Prototype testing procedure:
1. Heat up 150ml of water in a beaker on a hot plate set to high and heat it up to around 100 °c.
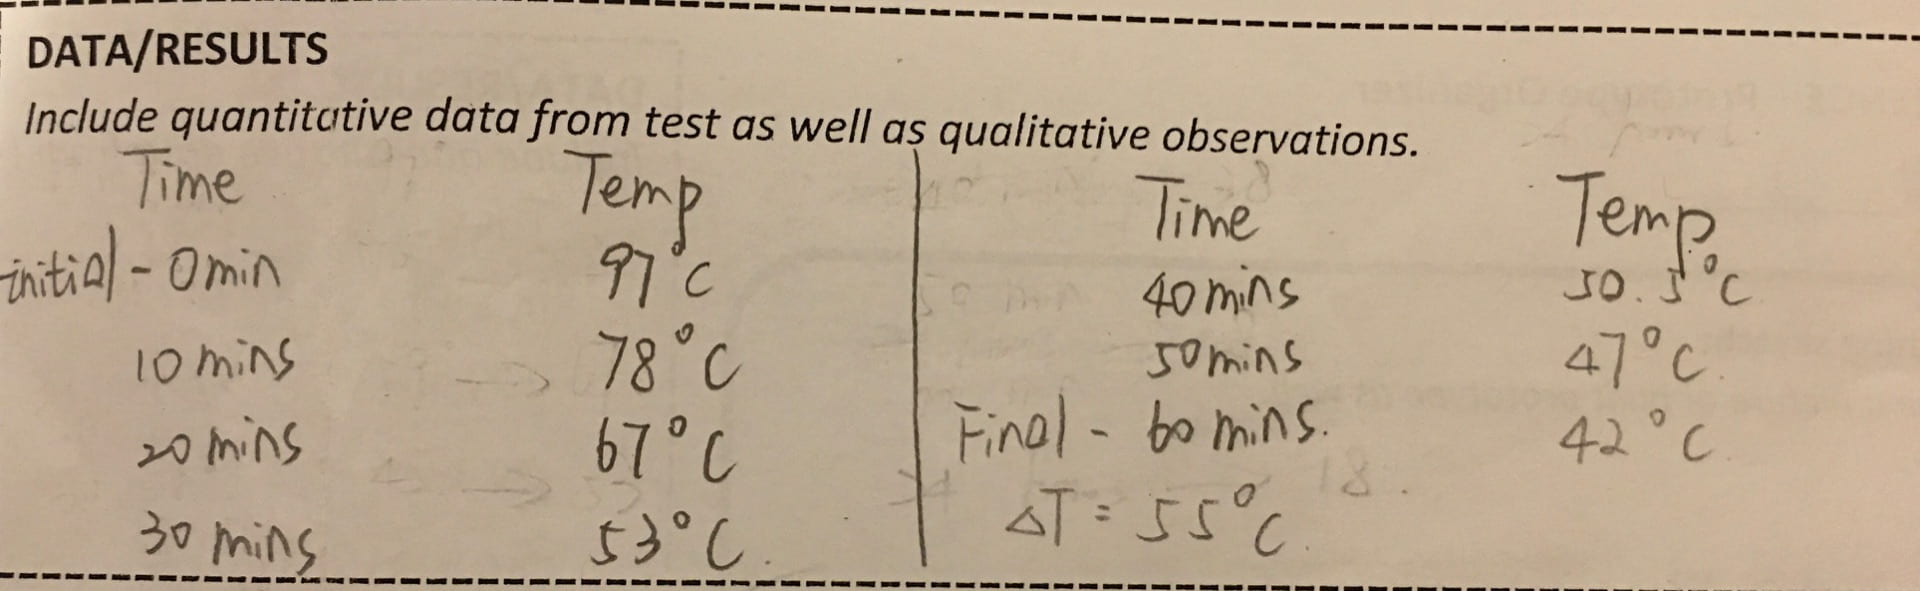
2. Take the initial temperature of the hot water as soon as it poured into the prototype thermos. Record the temperature and quickly place the cap on the thermos.
3. Leave the water for 20 minutes and observe any changes in the heat on the outside of the thermos.
4. Remove the cap and record the temperature of the water. Calculate the final and initial temperature difference.
5. Note any flaws and possible improvements that could be made to the design.
6. Make improvements based on the notes and repeat the procedure with the next prototype.
The idea behind this prototype is to reduce heat loss through heat transfer, so we use a lot of materials that have less thermal conductively, so the conduction of heat through the contact between the hot water and the material becomes weaker and slower.
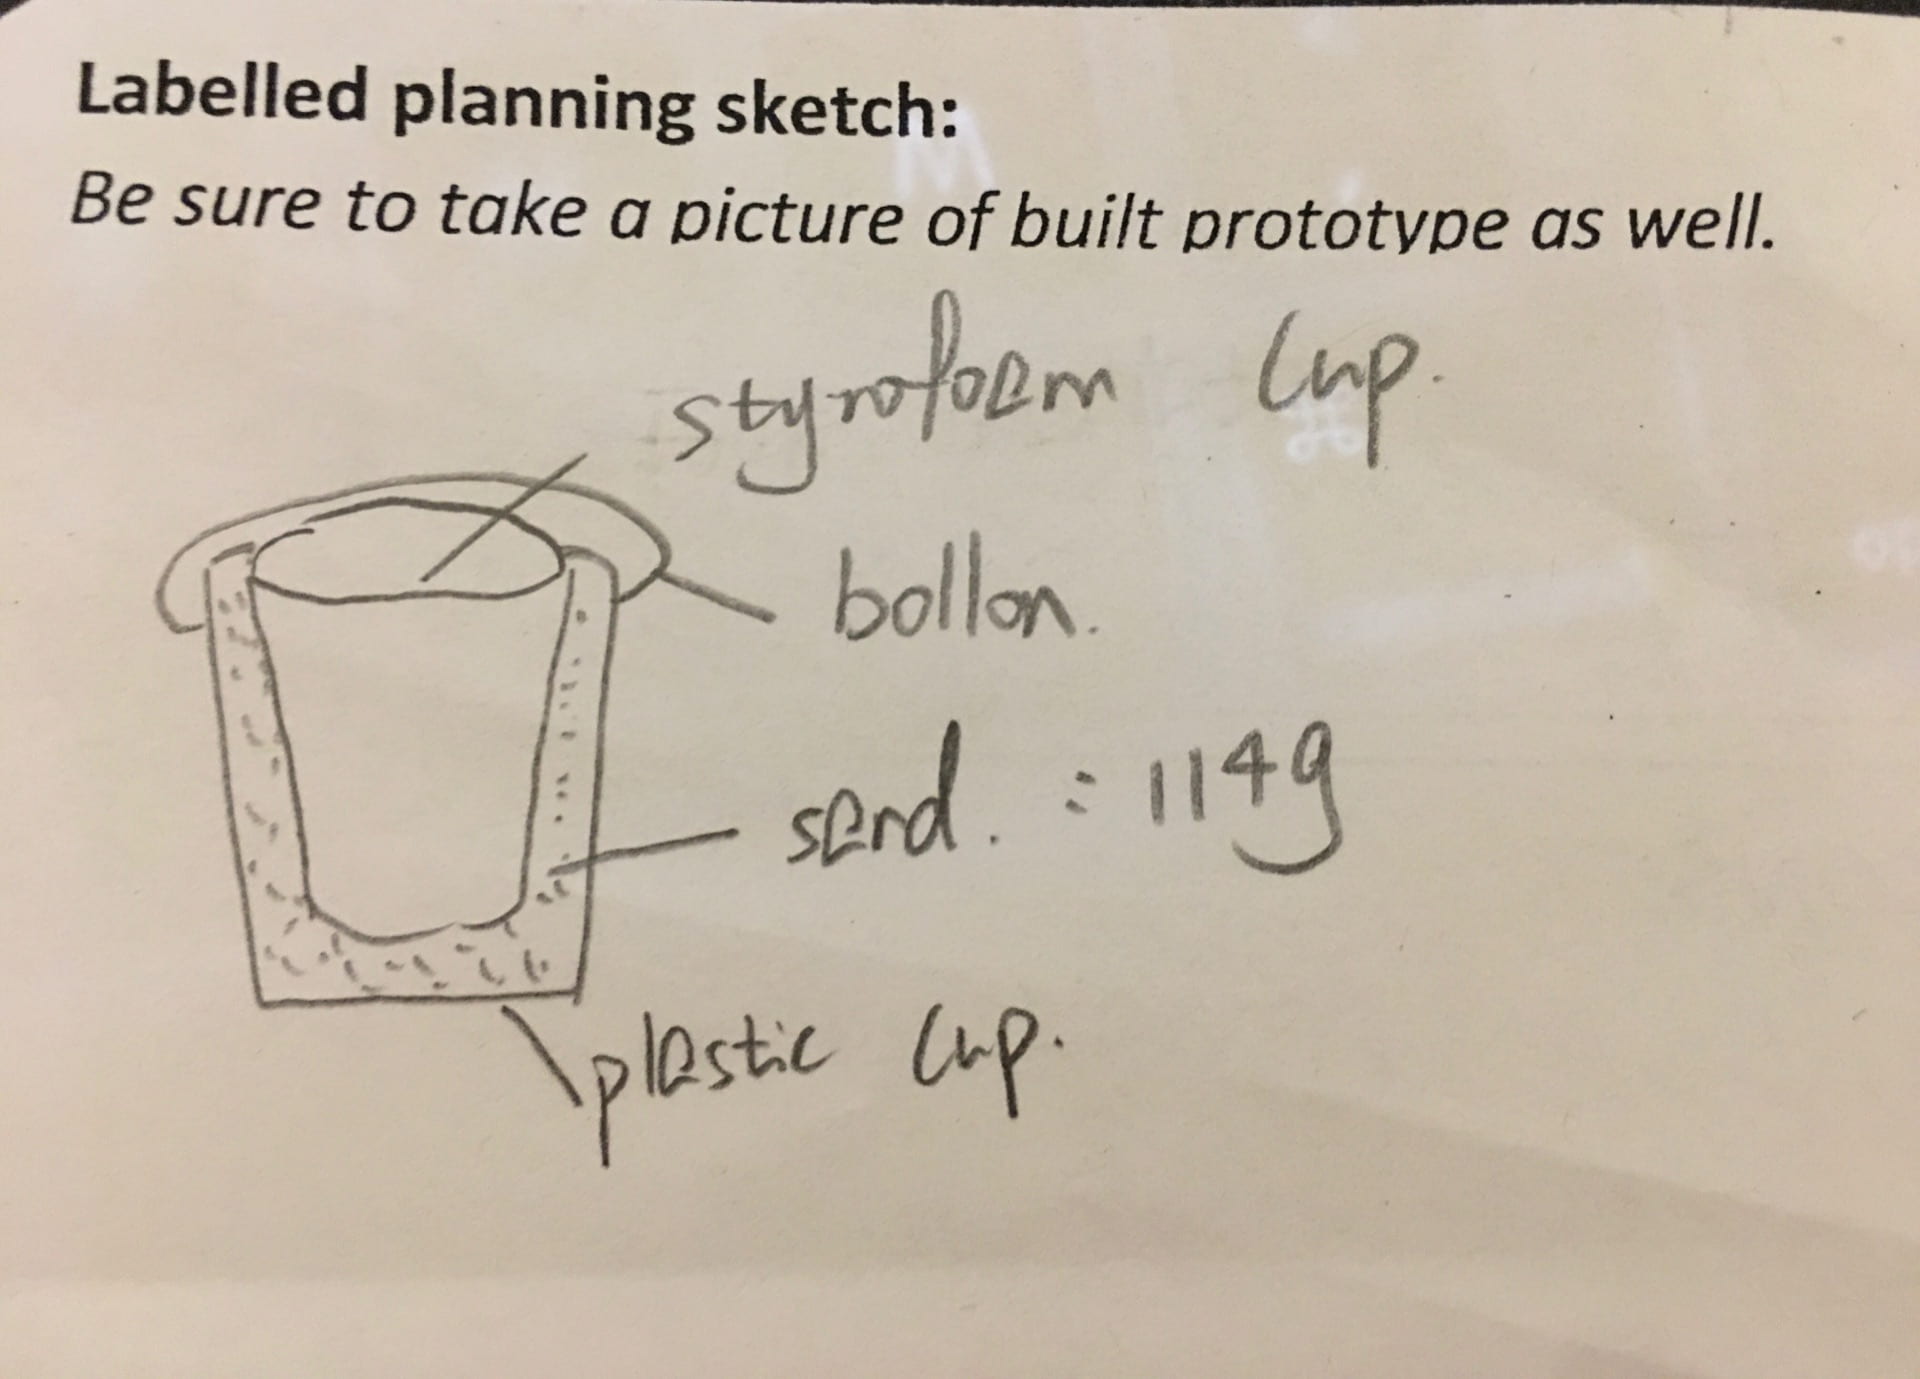
Prototype #1
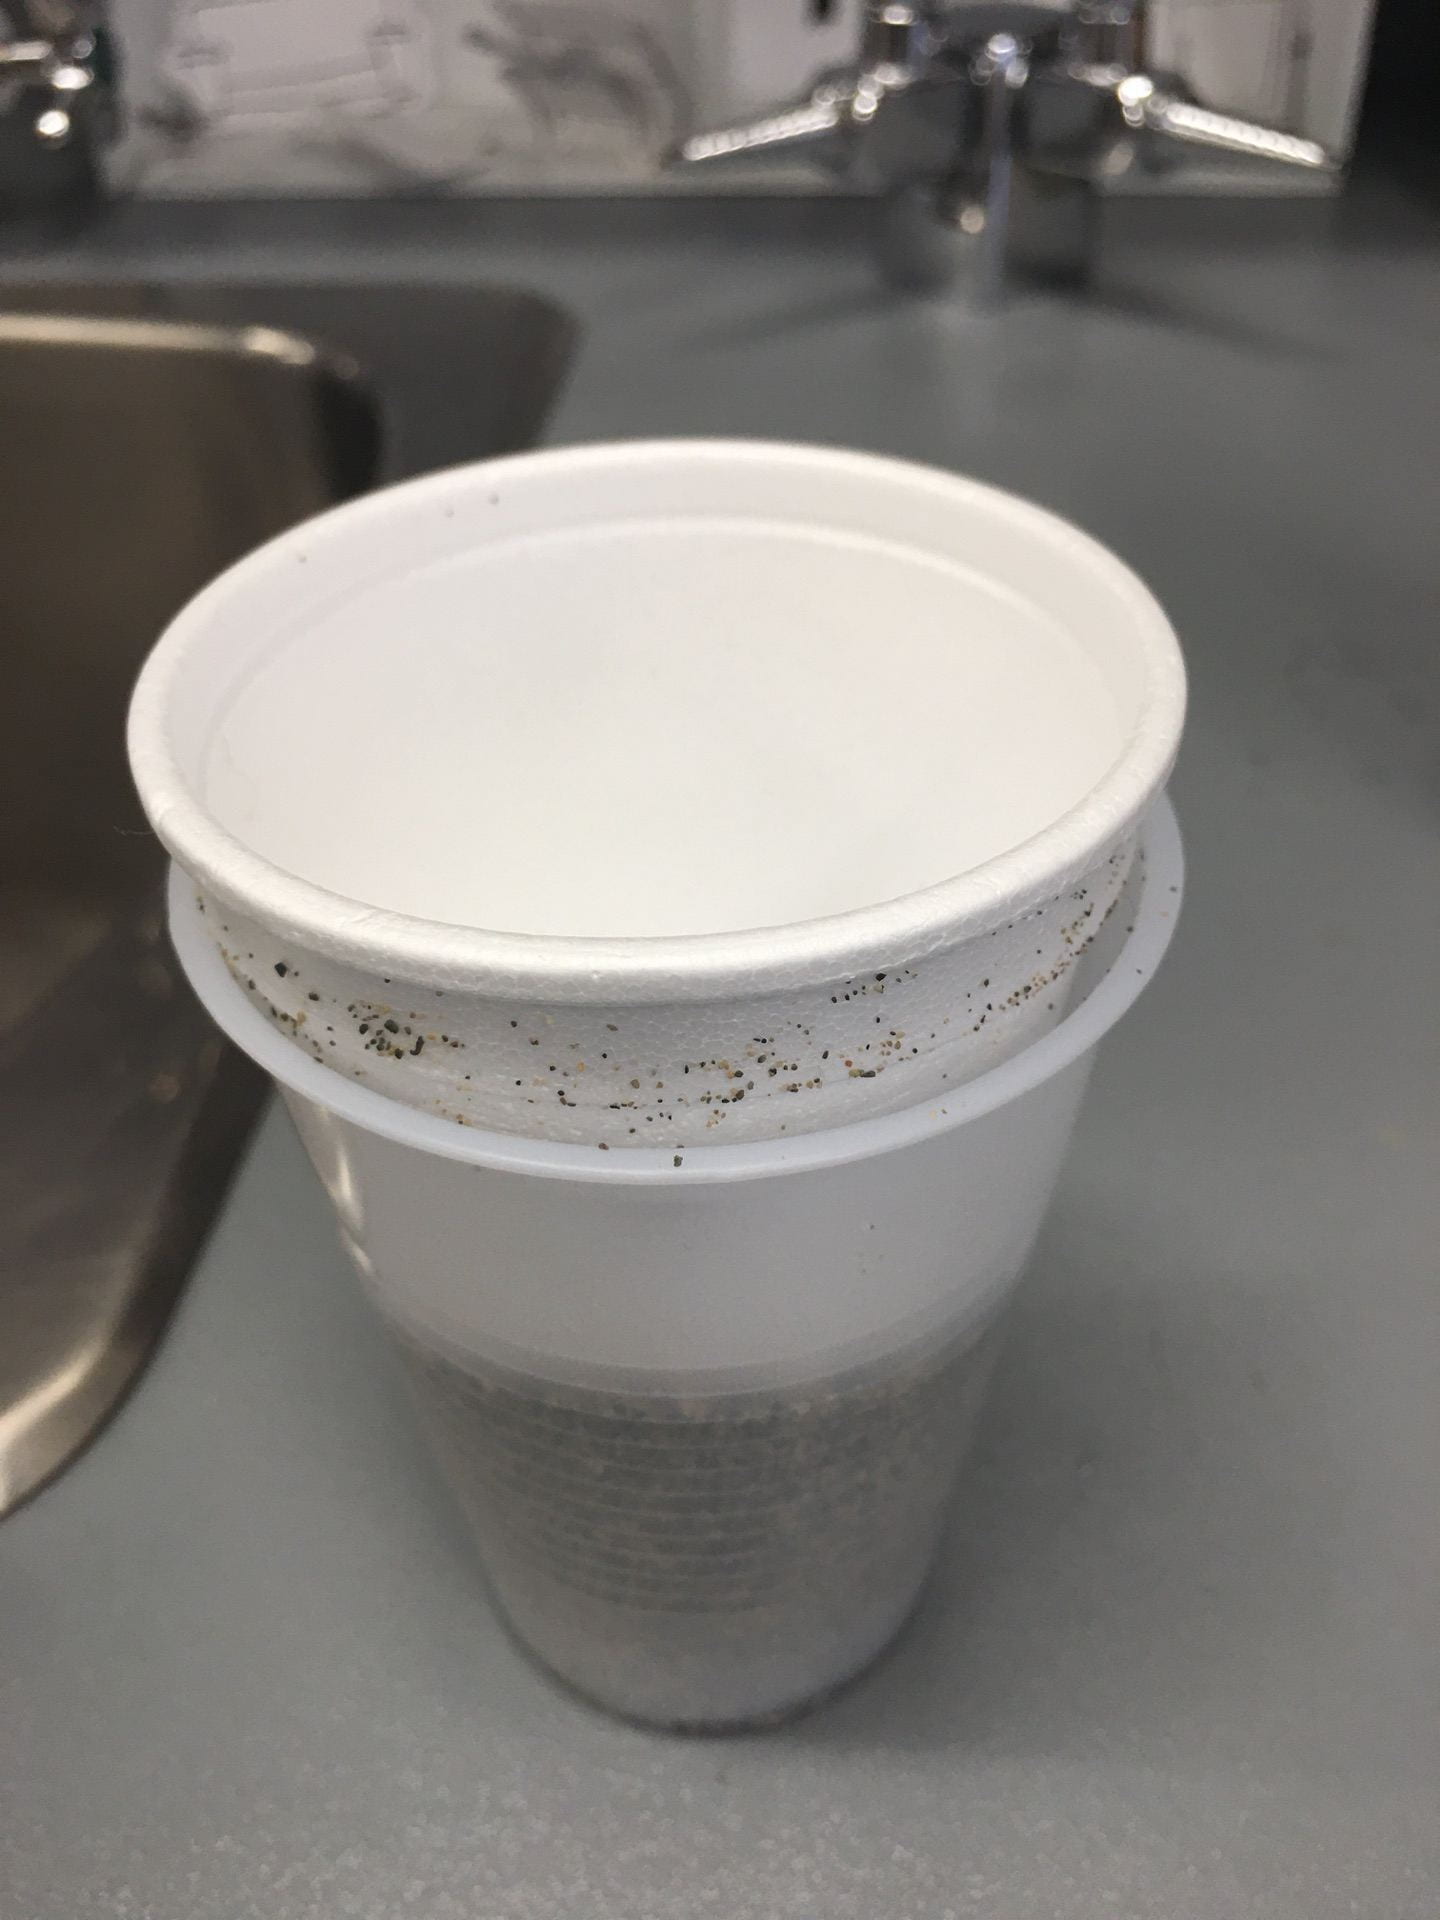
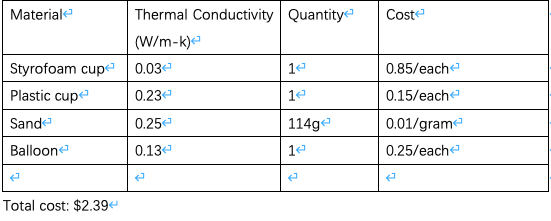
Materials list and cost
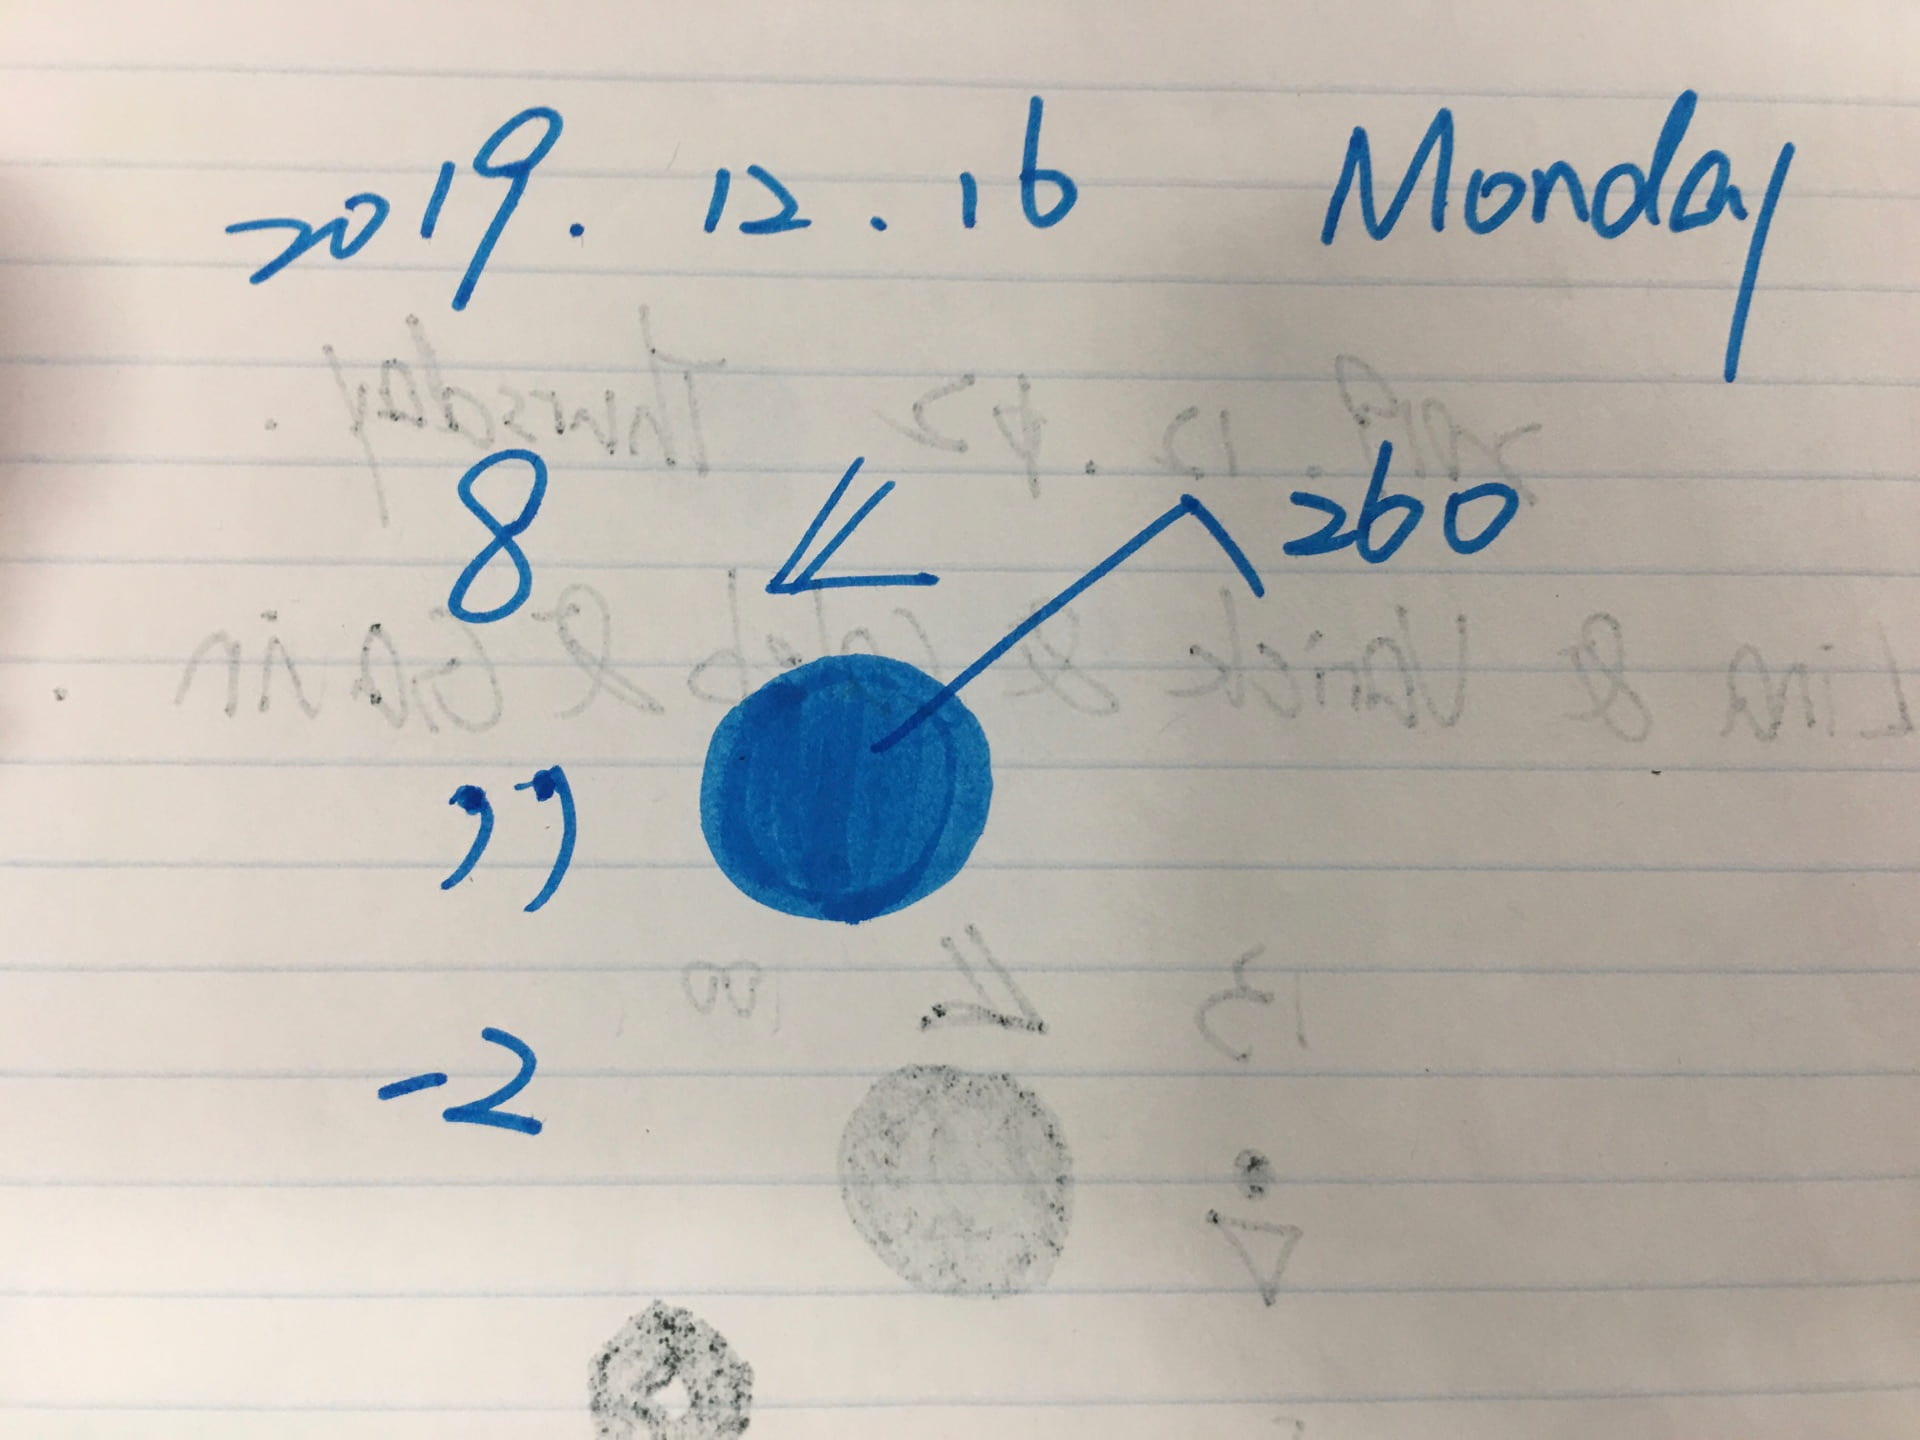
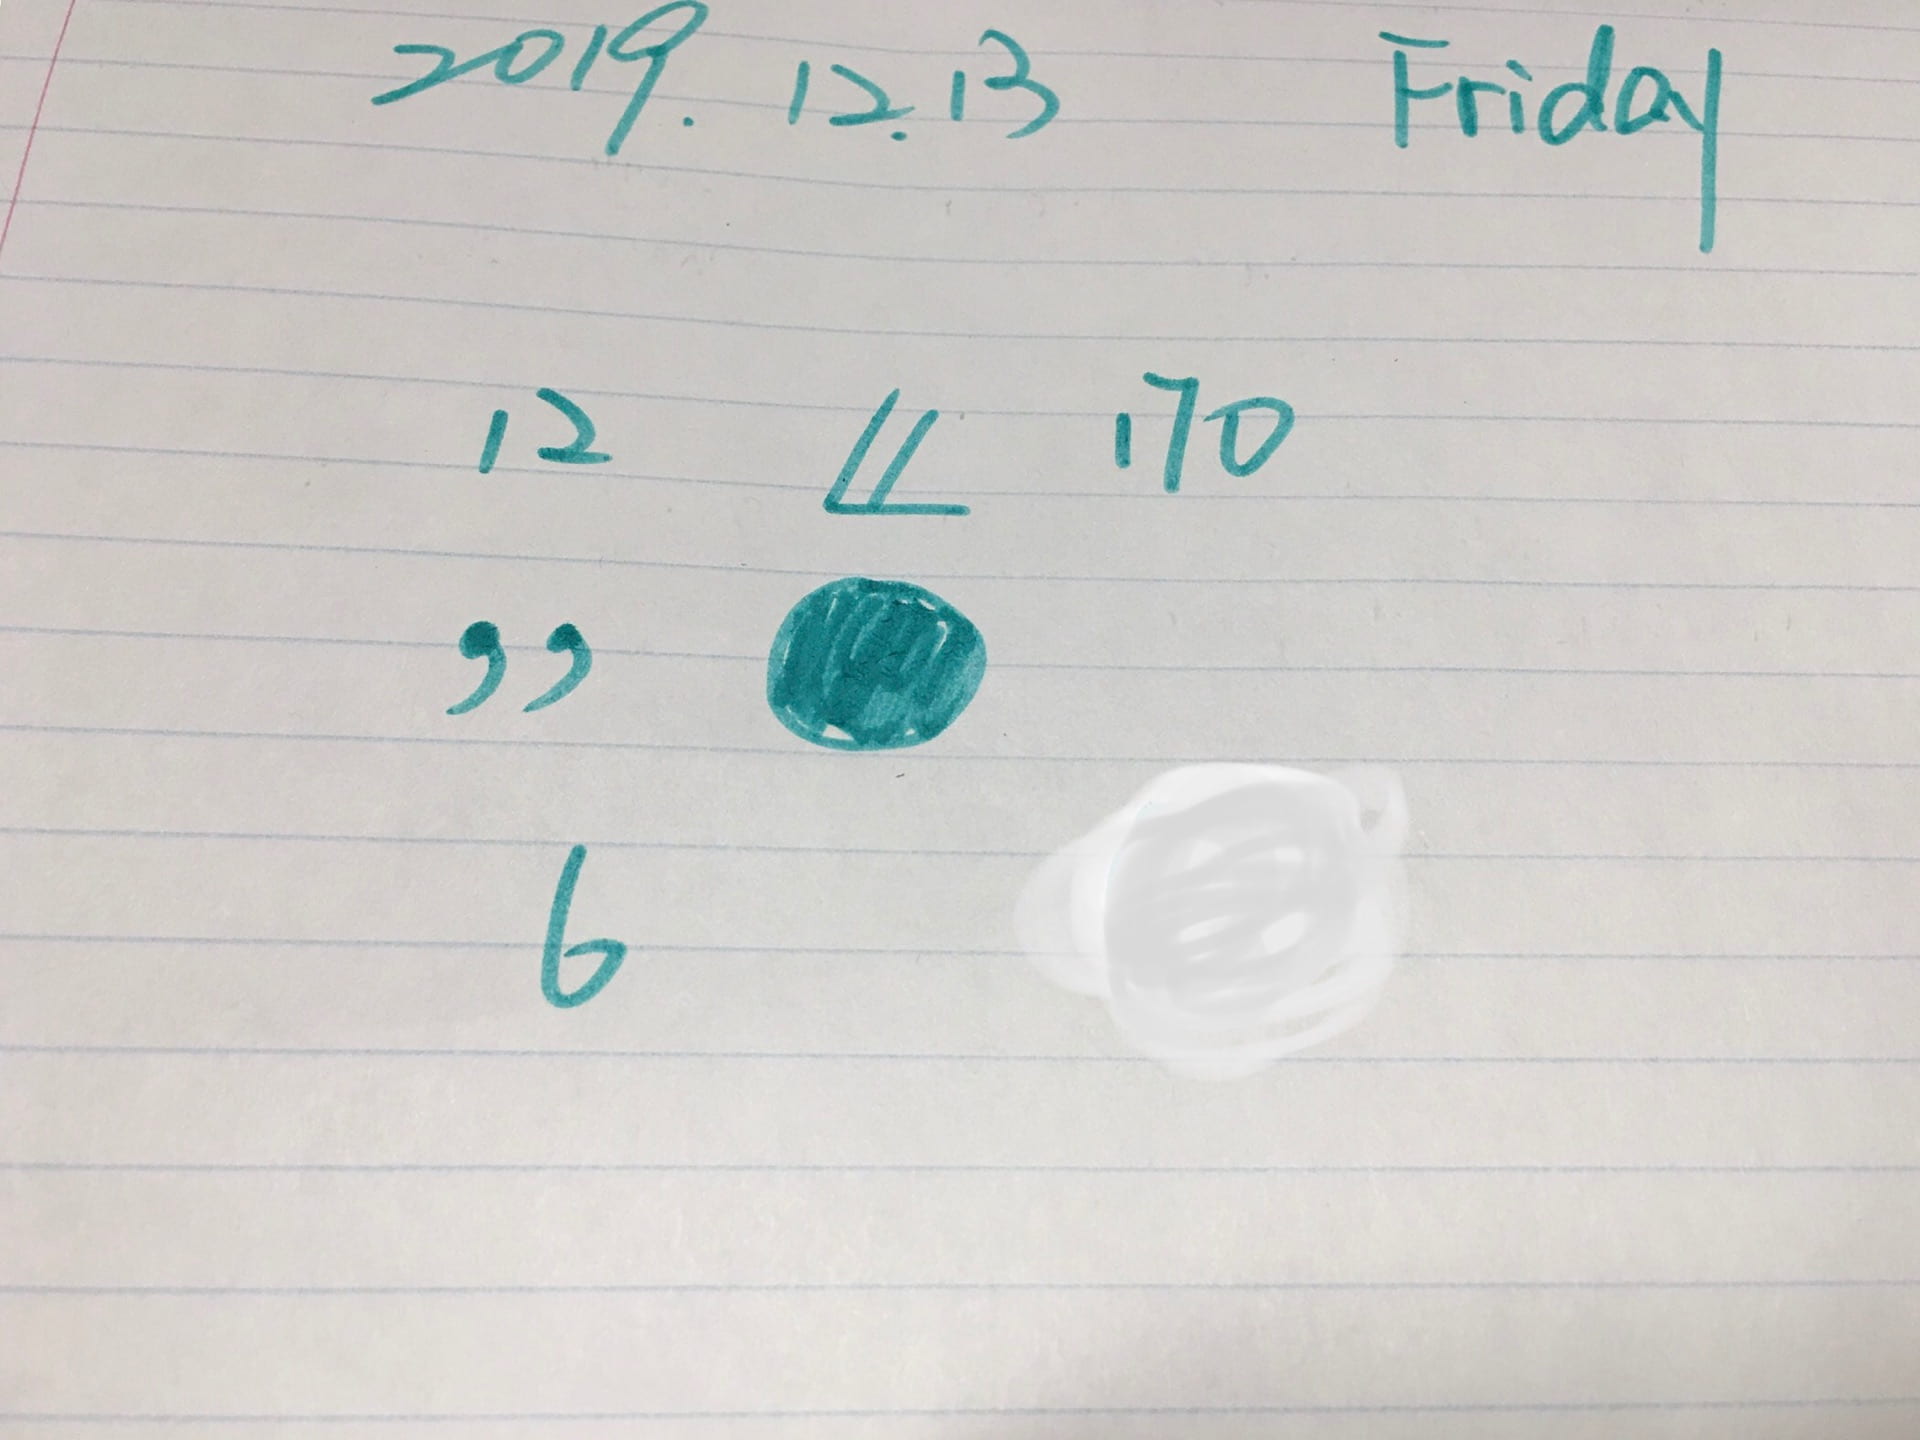
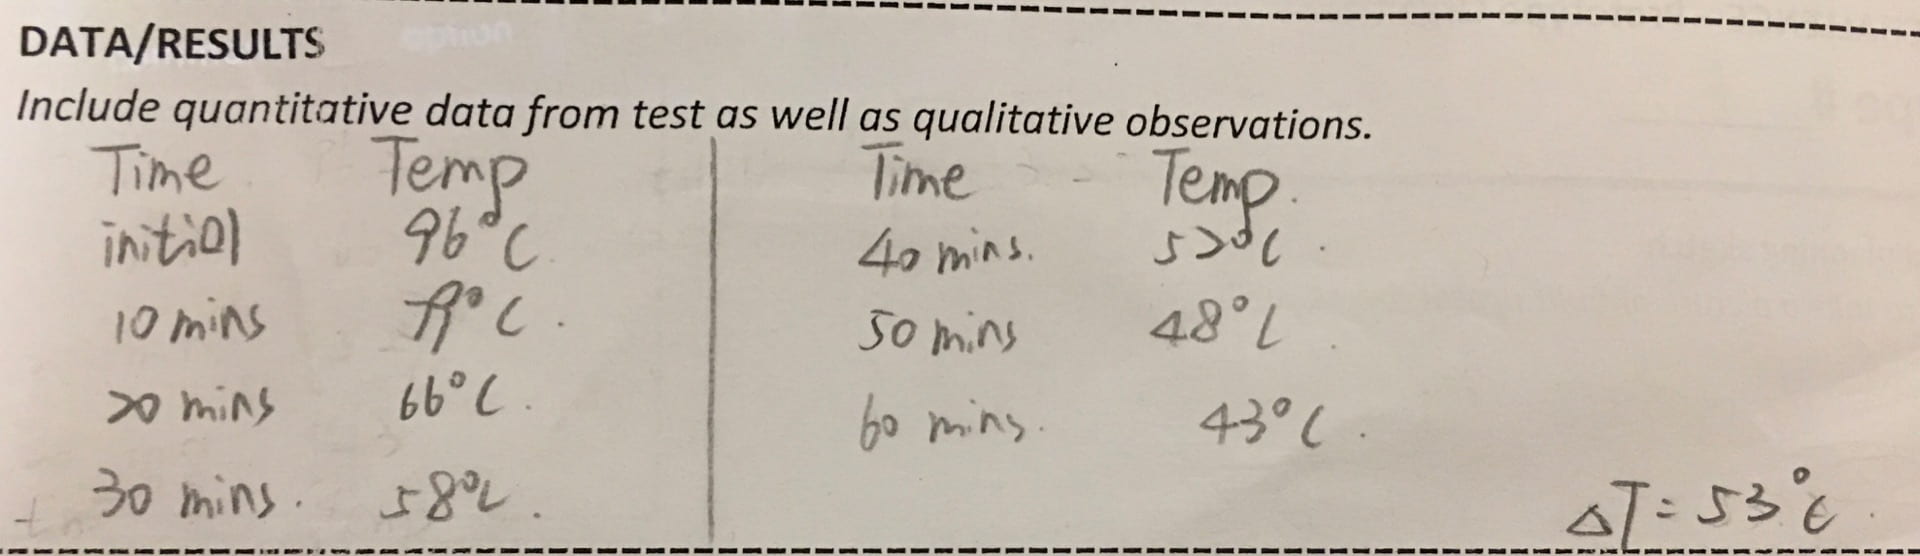
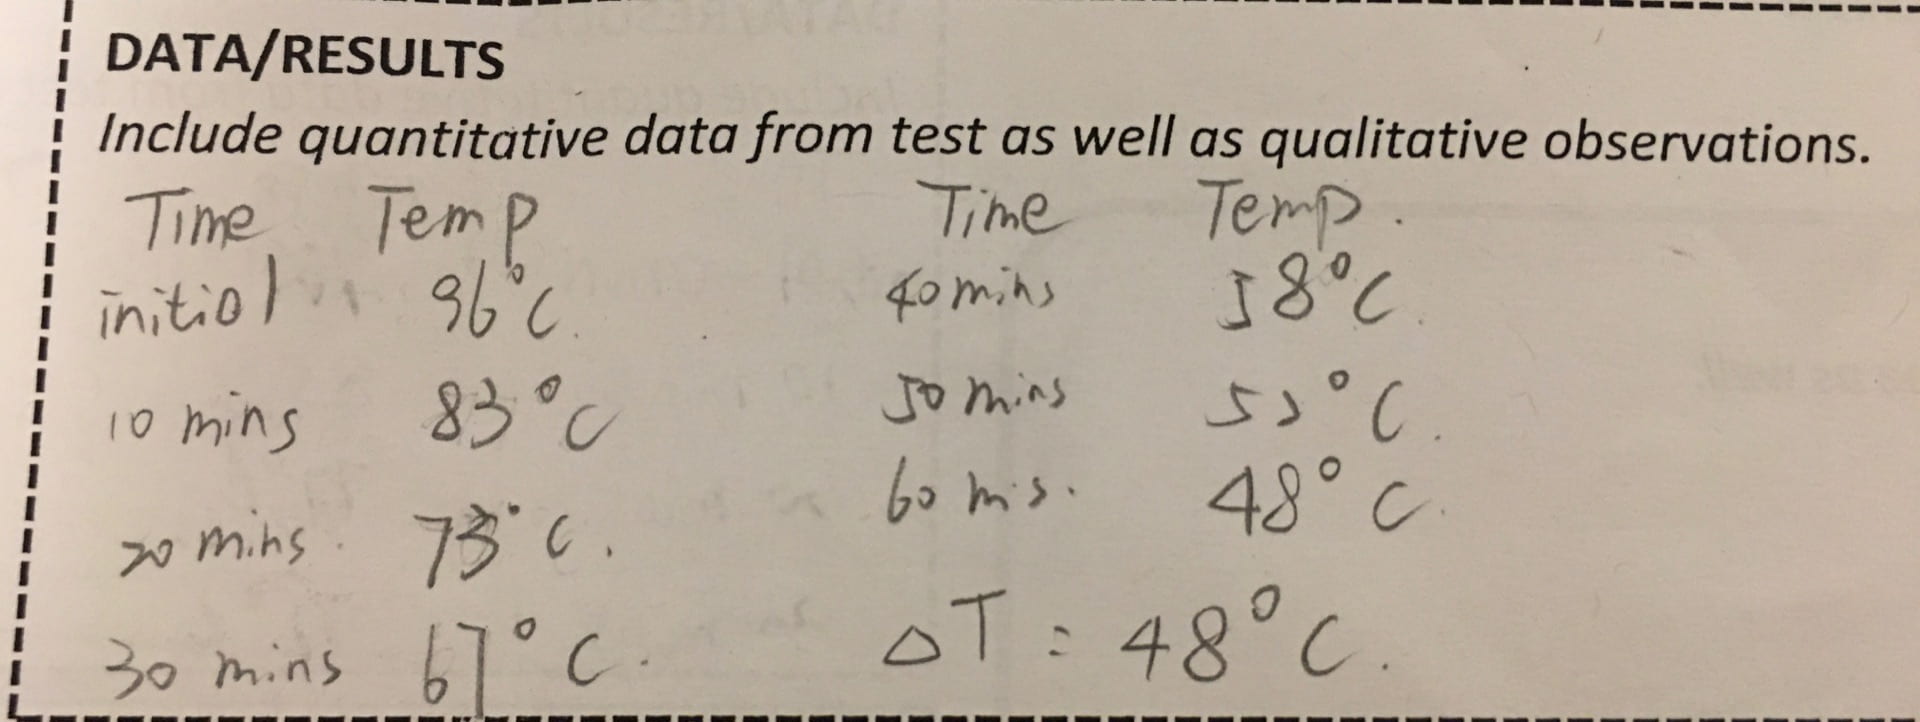
Data:
Pros:
1.Pretty cheap. Cheapest one in all three prototype.
Cons:
1.The appearance is simple, not attractive.
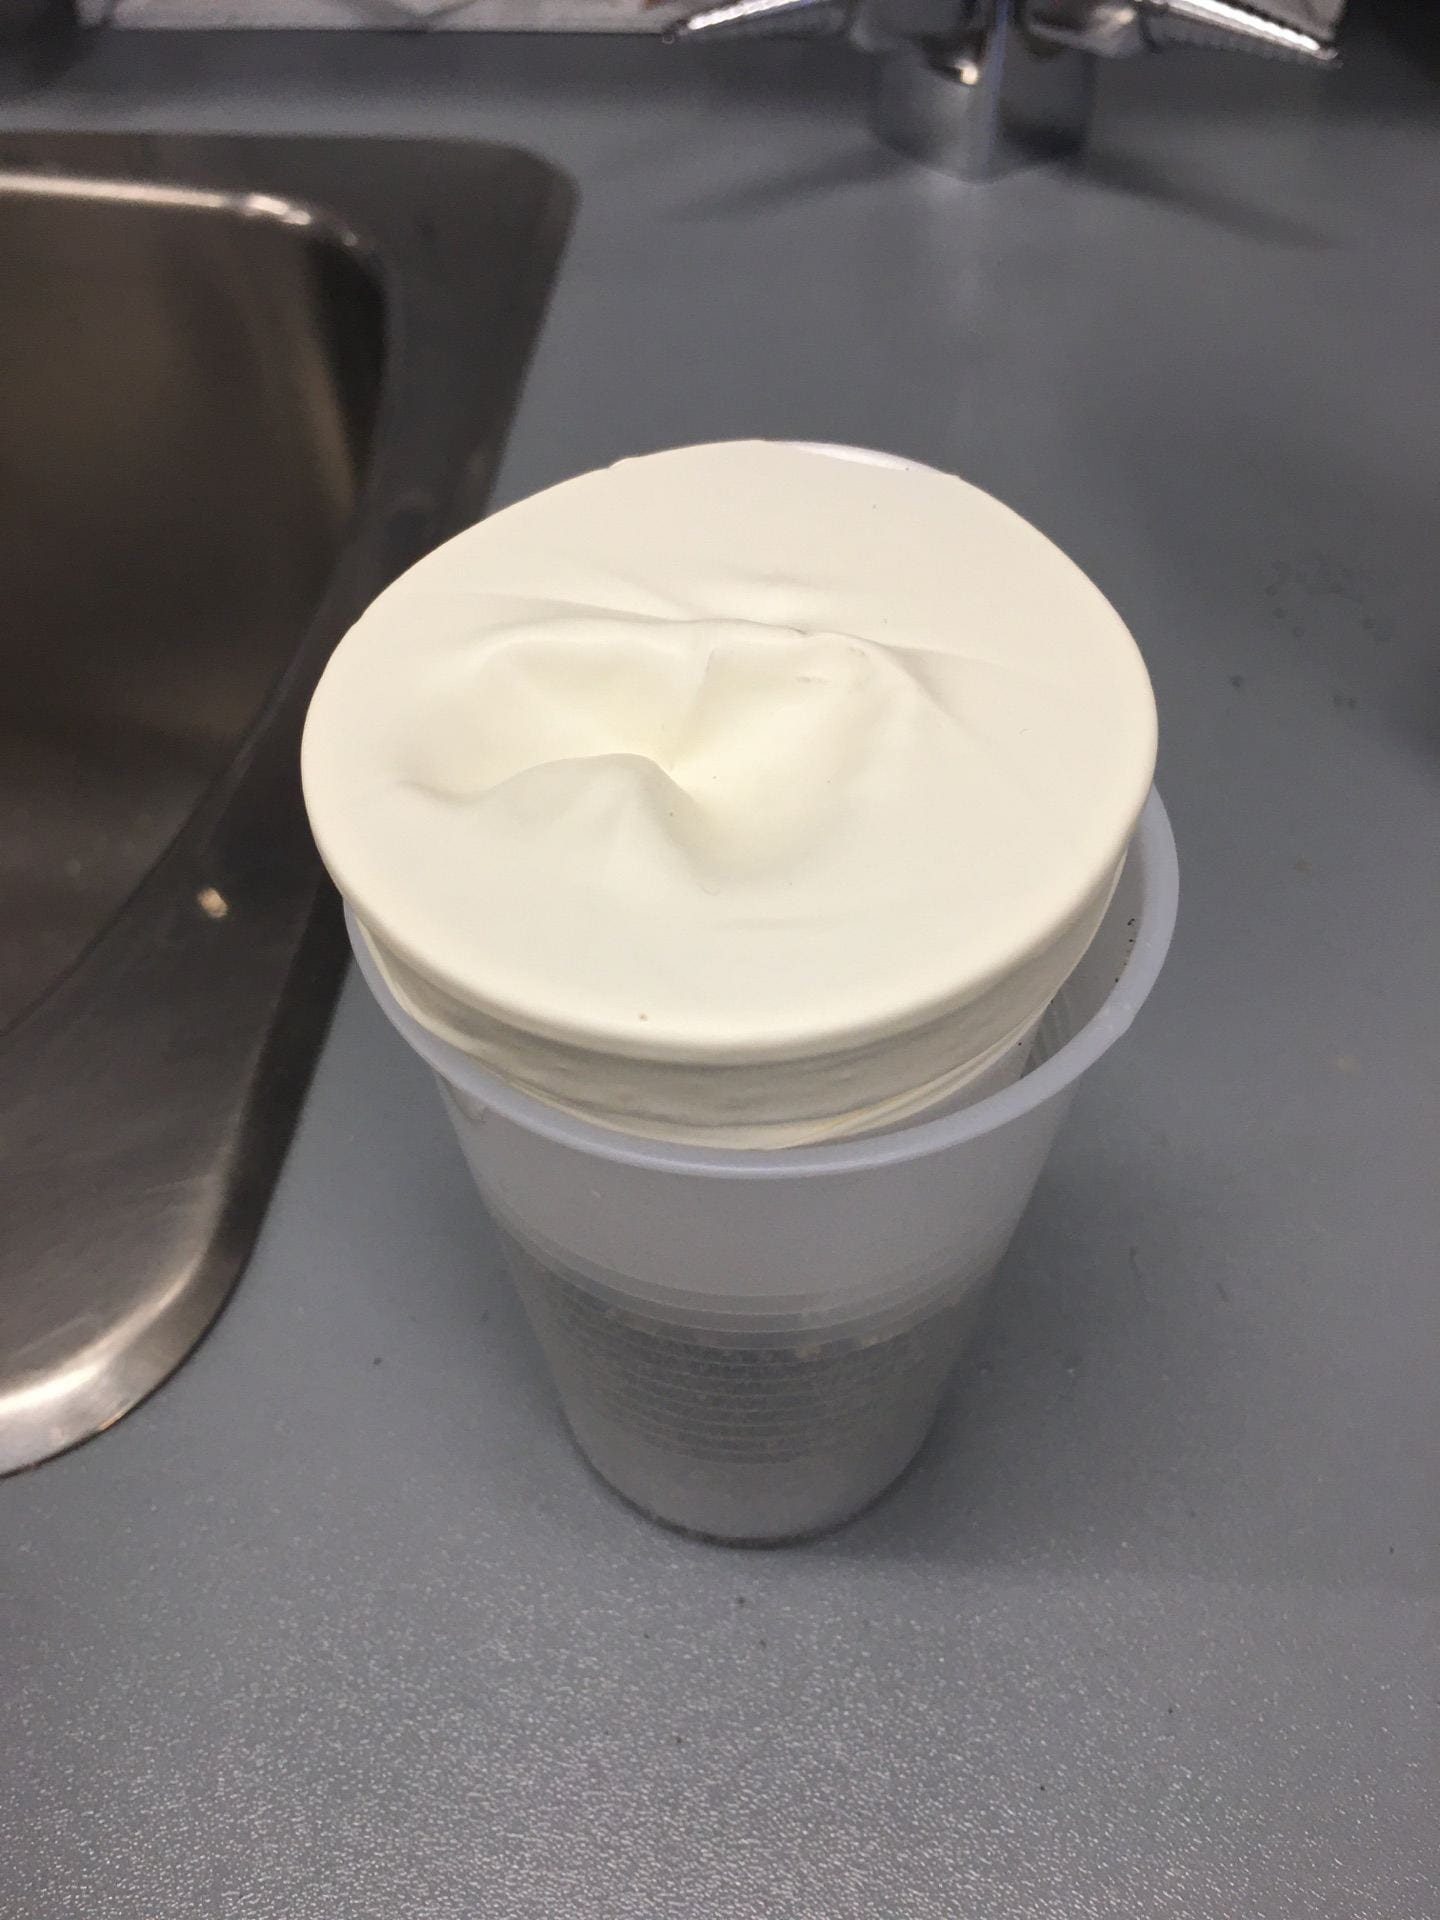
2.The lid (ballon) is not easy to take off, it takes time and will loss the heat by Conduction.
Progression:
– Improve external insulation to reduce heat loss.
– Try another material to make the lid.
– Add decoration to make themes look better.
Because sand has strong thermal conductivity and is easy to absorb thermal energy, we add sand between the cups, so that the sand absorbs the heat of water, and plays a role of heat insulation through the sand. On the other hand, due to the heat loss caused by convection inside the water, a large amount of heat of water molecules with higher molecular kinetic energy will move to the surface. If there is no cover, it will cause a large amount of heat loss, so we use a cut balloon As a cover.
Prototype#2


Materials list and cost

Pros:
1.Cheap.
2.General insulation effect.
Cons:
1.The appearance is simple, not attractive.
Progression:
– Try to add aluminum foil inside the foam cup, to absorb heat.
– Add decoration to make themes look better.
We made the second idea based on the first one to reduce heat transfer and enhance the heat reflection in the inner layer. Since aluminum foil has very strong thermal conductively, if used in the inner layer, it can strengthen thermal reflection and achieve the effect of ” reheating ”to keep heat. With a lid made of the foam cup, it can reduce the heat loss caused by convection inside the water.
Prototype#3
Materials list and cost
Data:
Pros:
1.Better insulation effect.
2.Beautiful appearance.
Cons:
The coffee cup lid have a hole on the top, which will loss heat through the hole.
Progression:
-Find something to cover the hole on the lid to reduce or slow down the heat dissipation.
-Use aluminum to cover the lid, to achieve better insulation effect.
The third major is a combination and improvement of ideas. We have used the aluminum foil in the second experiment to achieve the internal thermal insulation effect of “reheating the water.” It can better achieve the effect of external insulation.
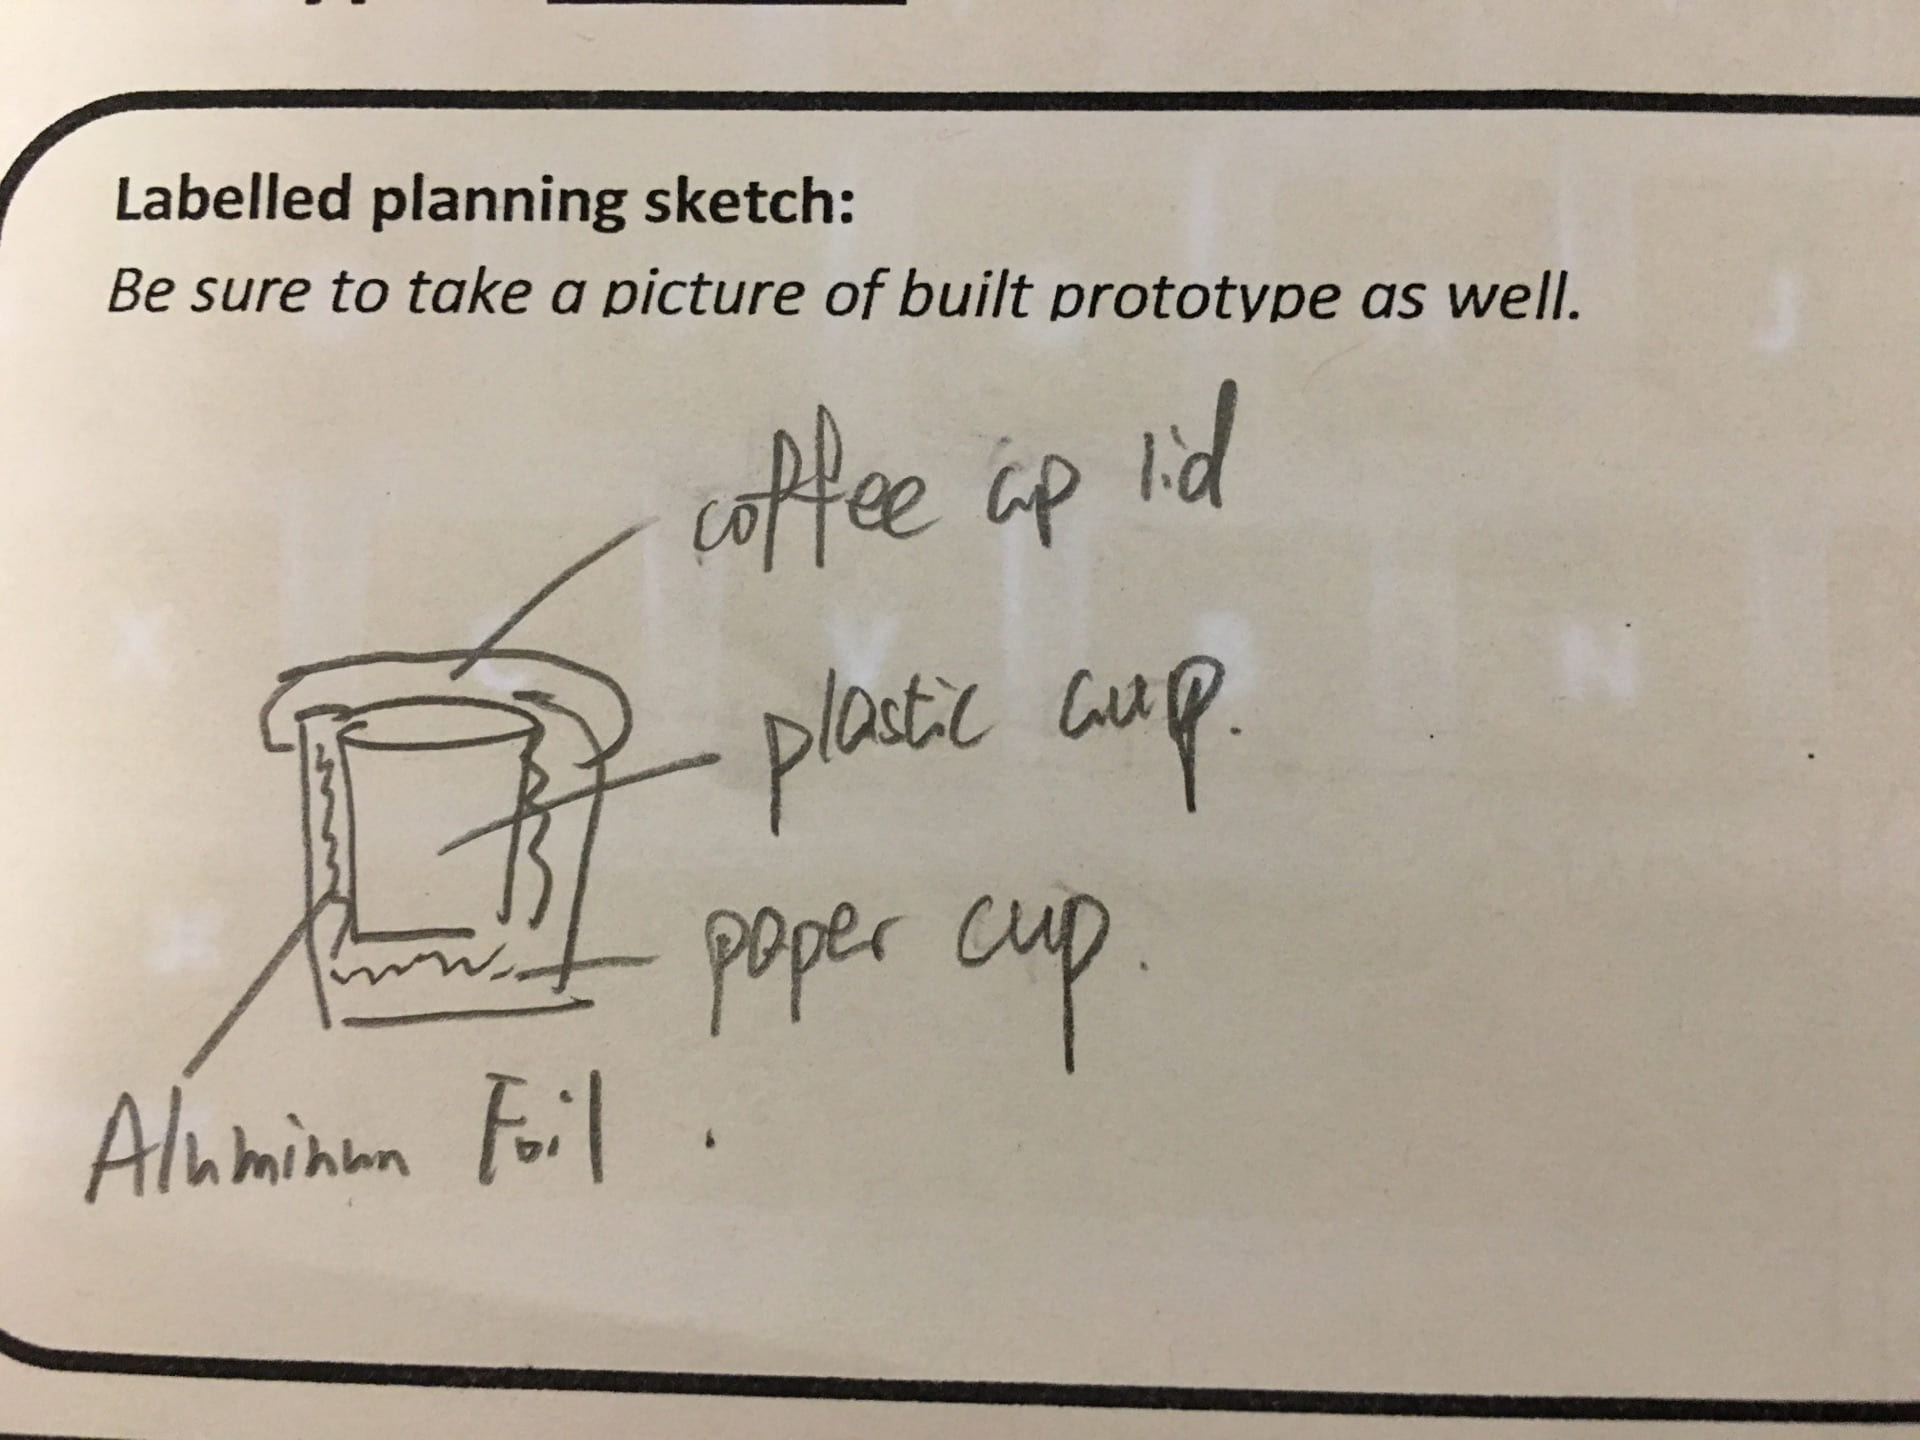
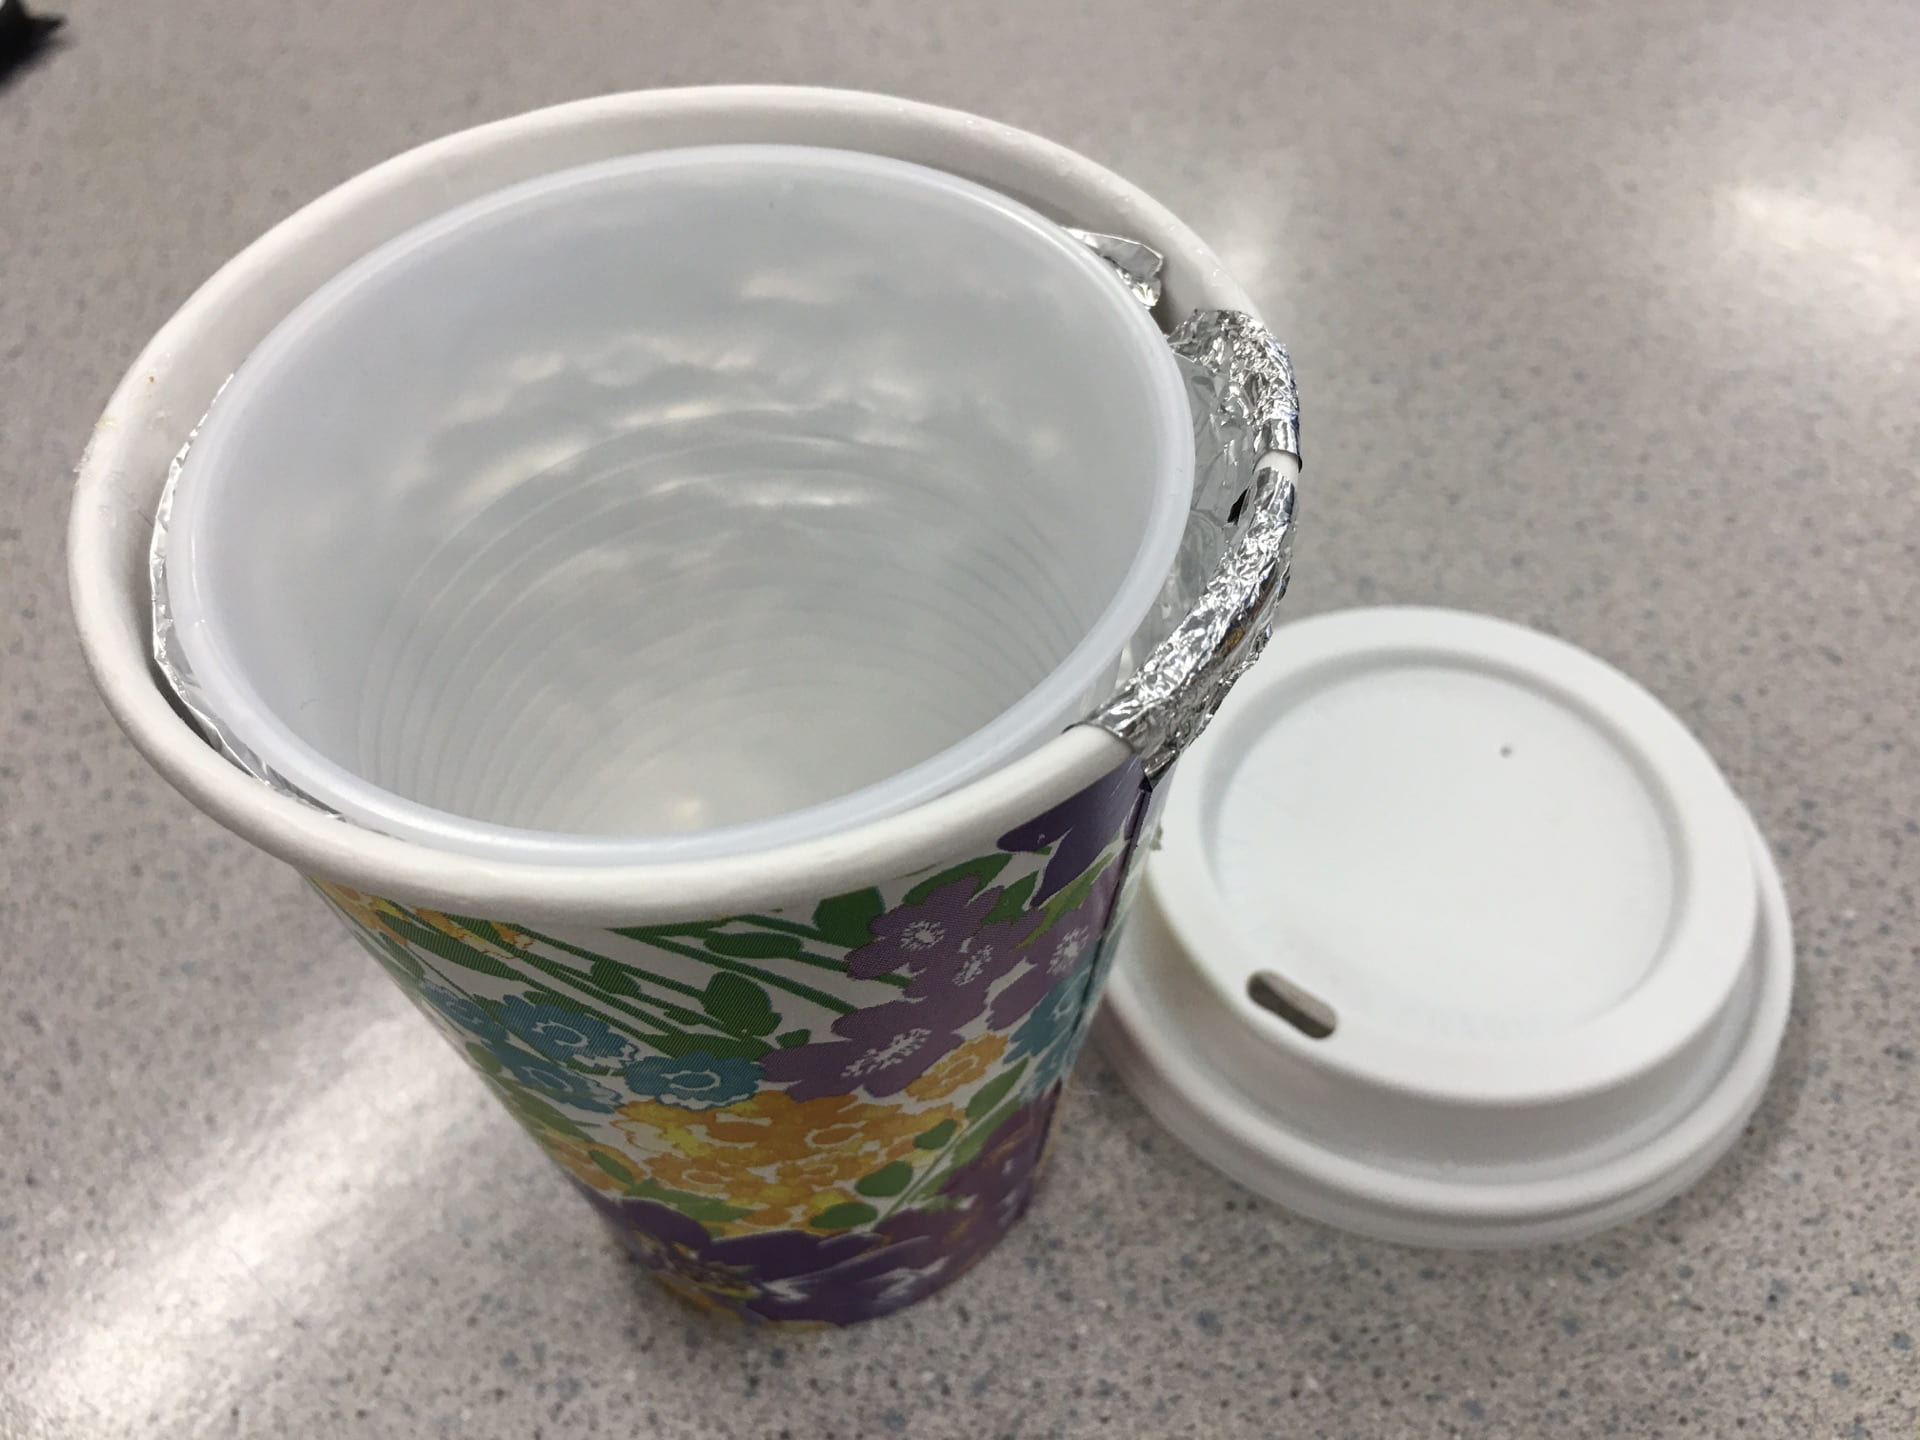
Final Product
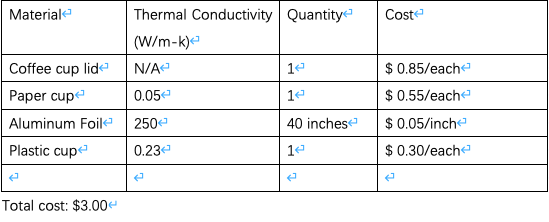
Materials list and cost
Data:

Our final product evolved from the third prototype, we proposed to add improvement of aluminum foil to the lid, and our final product is to test our hypothesis and improve. Since aluminum foil has very strong thermal conductively, if used in the inner layer, it can strengthen thermal reflection and achieve the effect of “reheating” to keep heat. The lid is made of aluminum foil, on the one hand, because of material price, on the other hand, because in the interior of the water can produce heat loss by convection, high quantity of heat of water molecules have higher molecular kinetic energy will move to the surface, if there is no lid can cause a lot of heat loss, and we want to use radiation of aluminum foil to reduce heat loss.
Overall, water in the prototype lose heat main is by conduction, so we are doing the project’s main idea is to use less thermal conductivity of materials to reduce heat conduction, so each of our design in outer do have “shell”, and through the results of the first we knew, the “shell” is not enough to reduce conduction, we need to strengthen inside, so we adopt with radiation heat material for “heating water again”.And at the top of the design is similar to the cup body, which is also using thermal conductivity less to reduce heat loss. But the second main consideration is the use of radiation, which reflects heat, to conserve it.
 Loading...