May
18
Math 10 Week #13
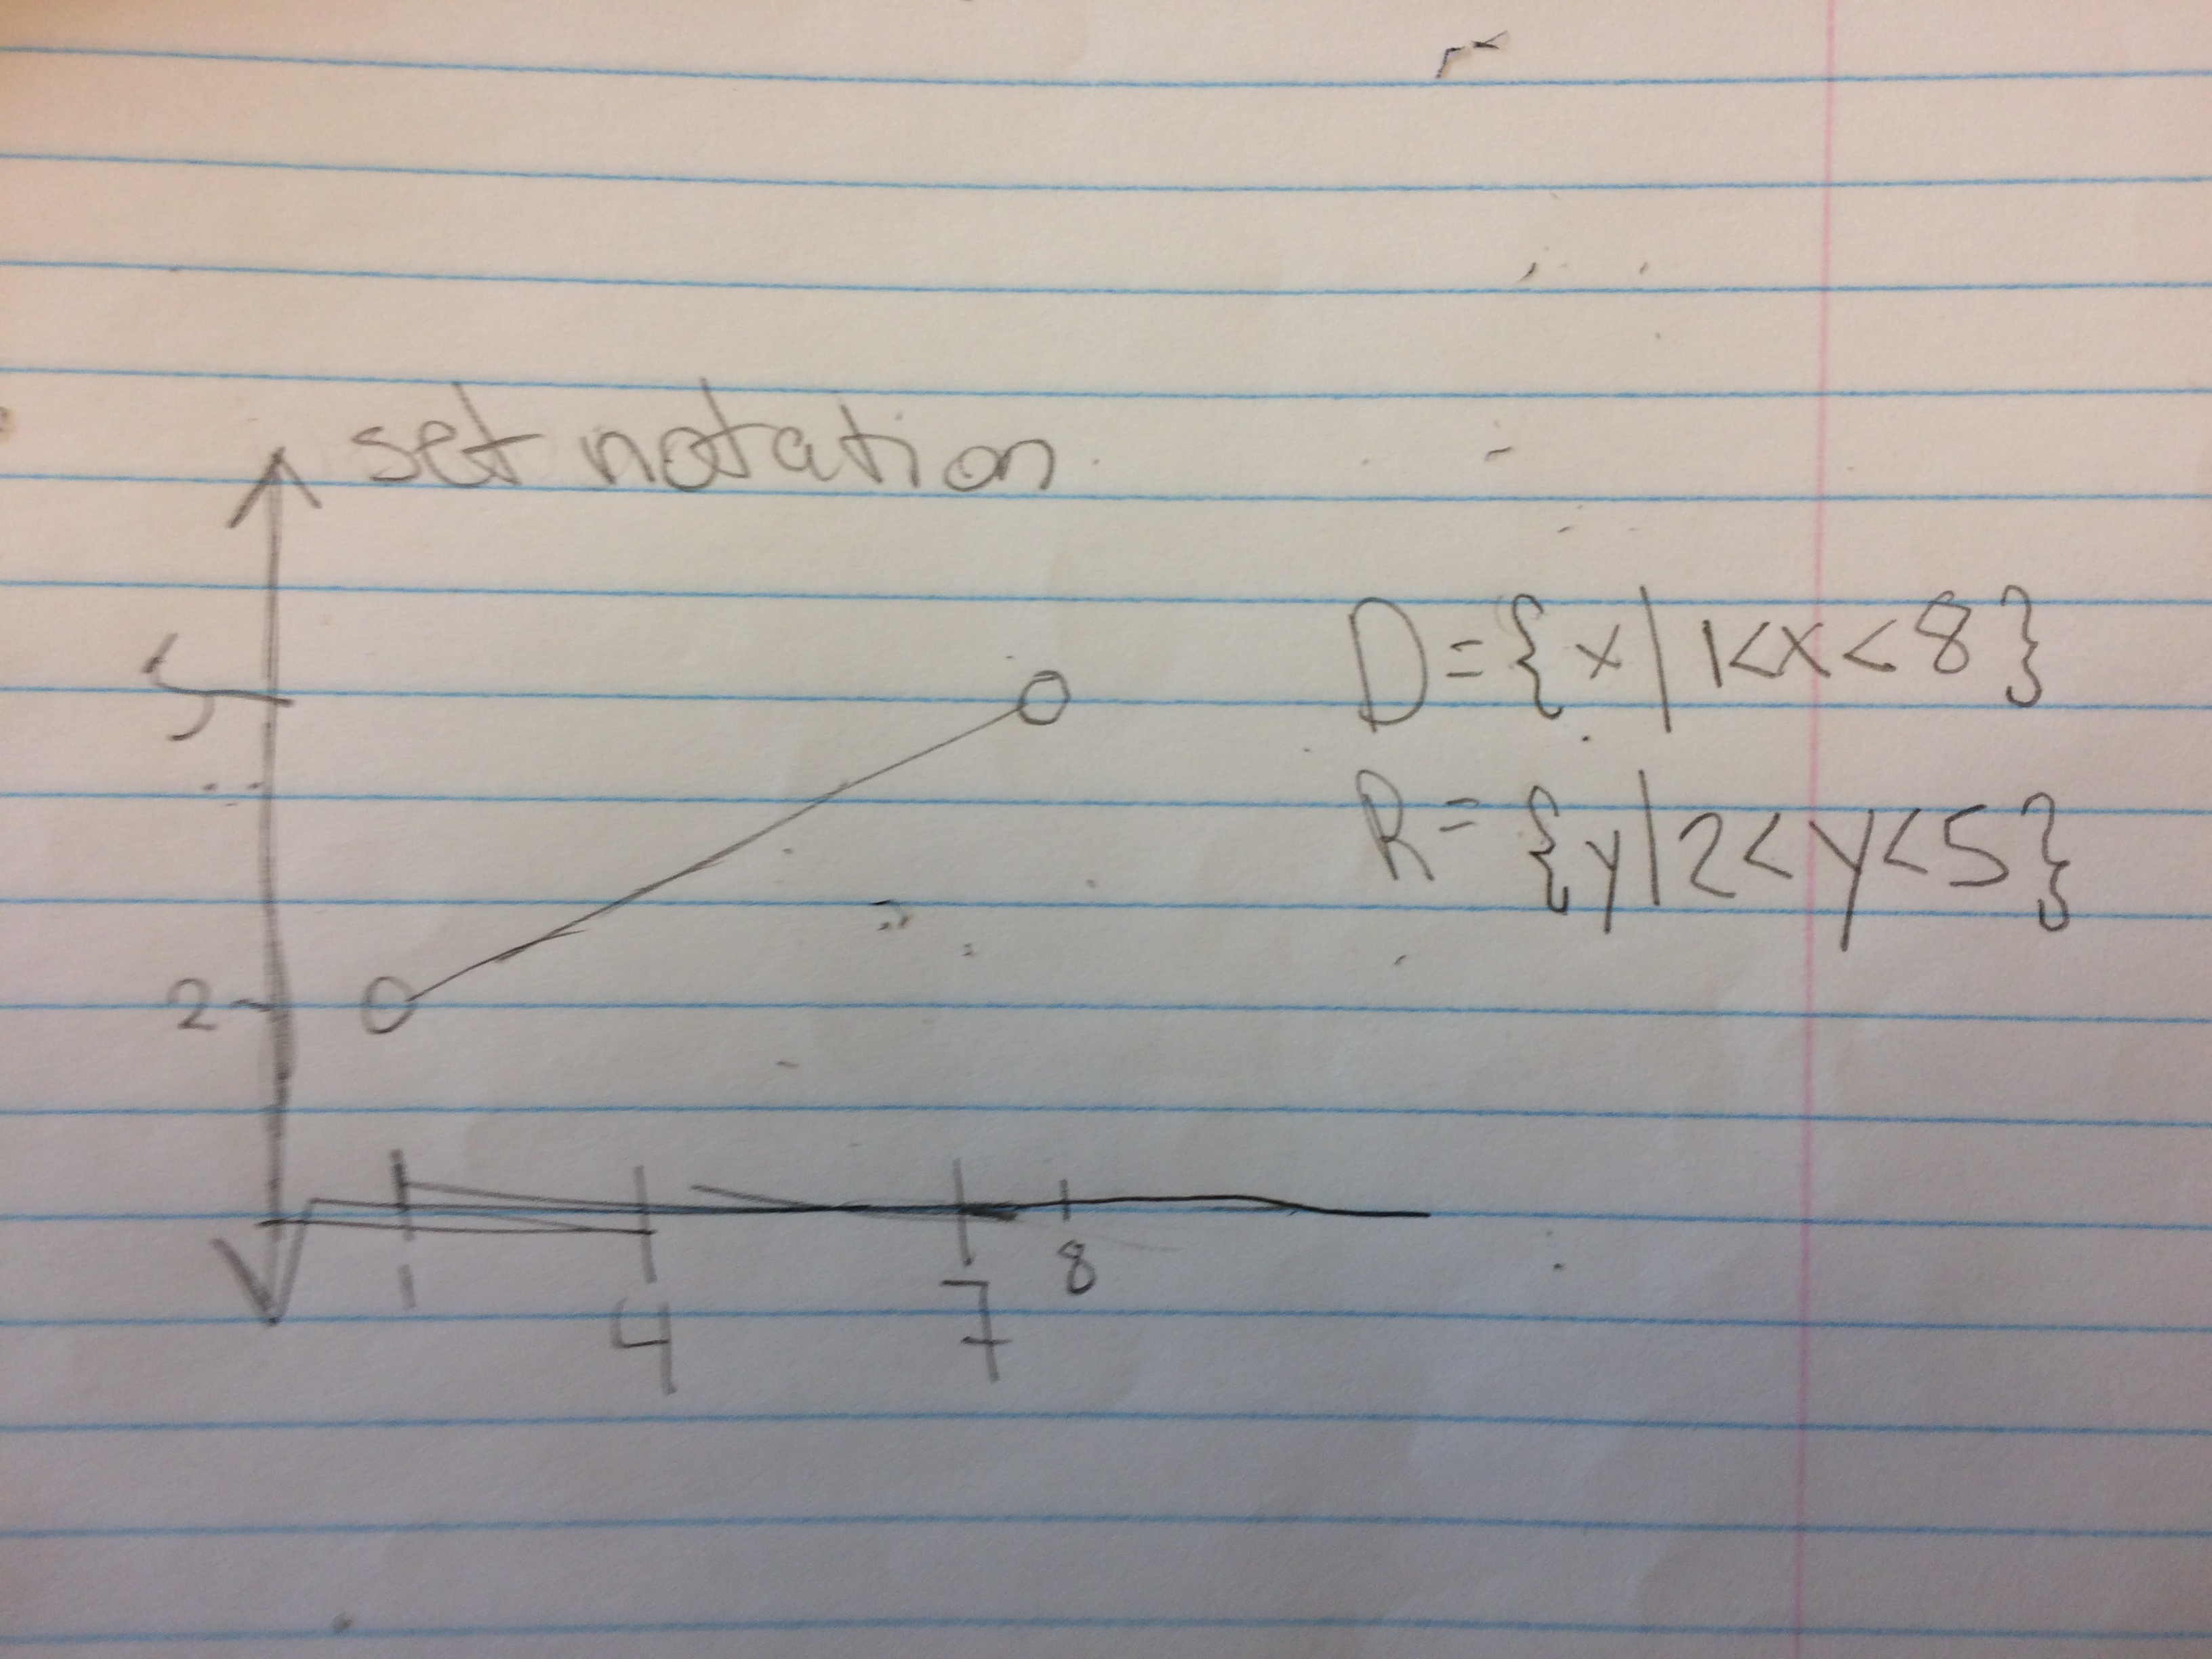
this is how to represent a set notation from a graph, I will be showing you domain and range.
first we’ll start with domain and domain uses the x axis, with our graph our line starts at 1 on the x axis and ends at 8 and everything between there is x, not 1 and 8 because the circles are open where the numbers are, giving us domain equaling 1<x<8. moving onto the range being the y axis it starts at 2 and ends at 5 and x being everything in between but not 2 and 5 because again the circles are open which means you don’t include them in x making the range equal to 2<x<5