Apr
2019
Week 11- Pre calc 11
This week was a shortened week so we didn’t go over as much stuff as the previous weeks.
We learned how to graph quadratic and linear inequalities in one variable and two variables.
To graph a quadratic inequality you need to find the y- intercept and the vertex and use the clues given to graph it and find possible solutions and where to shade in the graph.
For example:
y>x^2+6x-18
the y intercept is -18
you can tell it opens up because the x^2 is positive
the vertex moved
and the pattern is 1.3.5 because the leading coefficient is 1
So then you would factor
y>x^2+6x-18
y> (x+8)(x-2)
and with those you can find your vertex from -8 and +2 being your x- intercepts
to find the vertex you would do -8+2/2
so your vertex is -3
and by plugging it back into you equation you can find the minimum point connected to the vertex and graph it
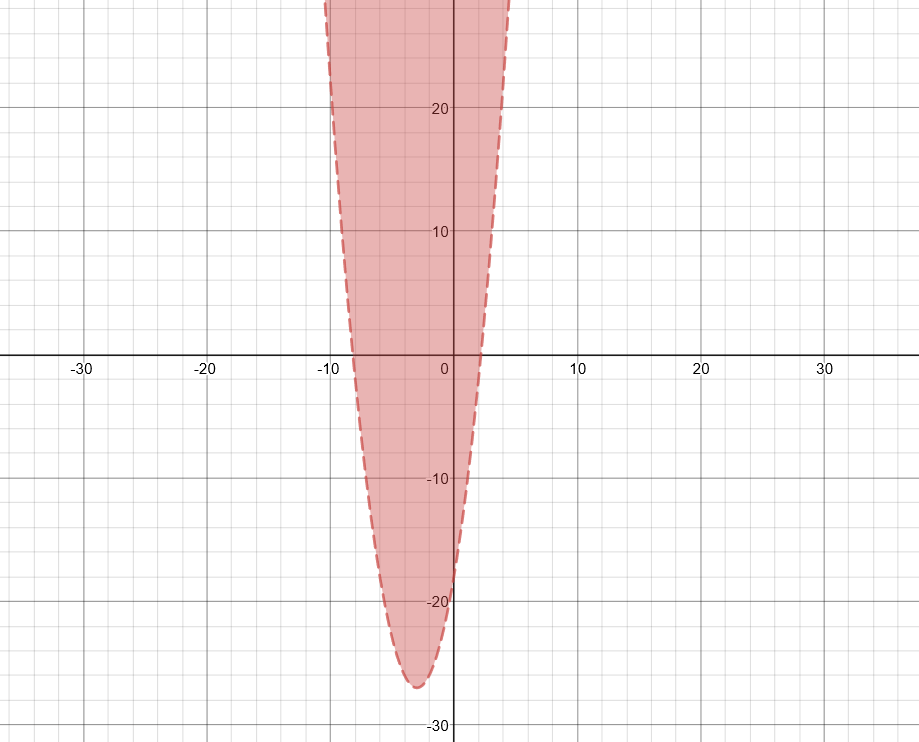
we know that its a doted line because the > doesn’t have a line underneath it
and we can put a test point into the original equation to know if its shaded in, in the certain area.