IMG_8822-1racn72

Explanation of all the steps:
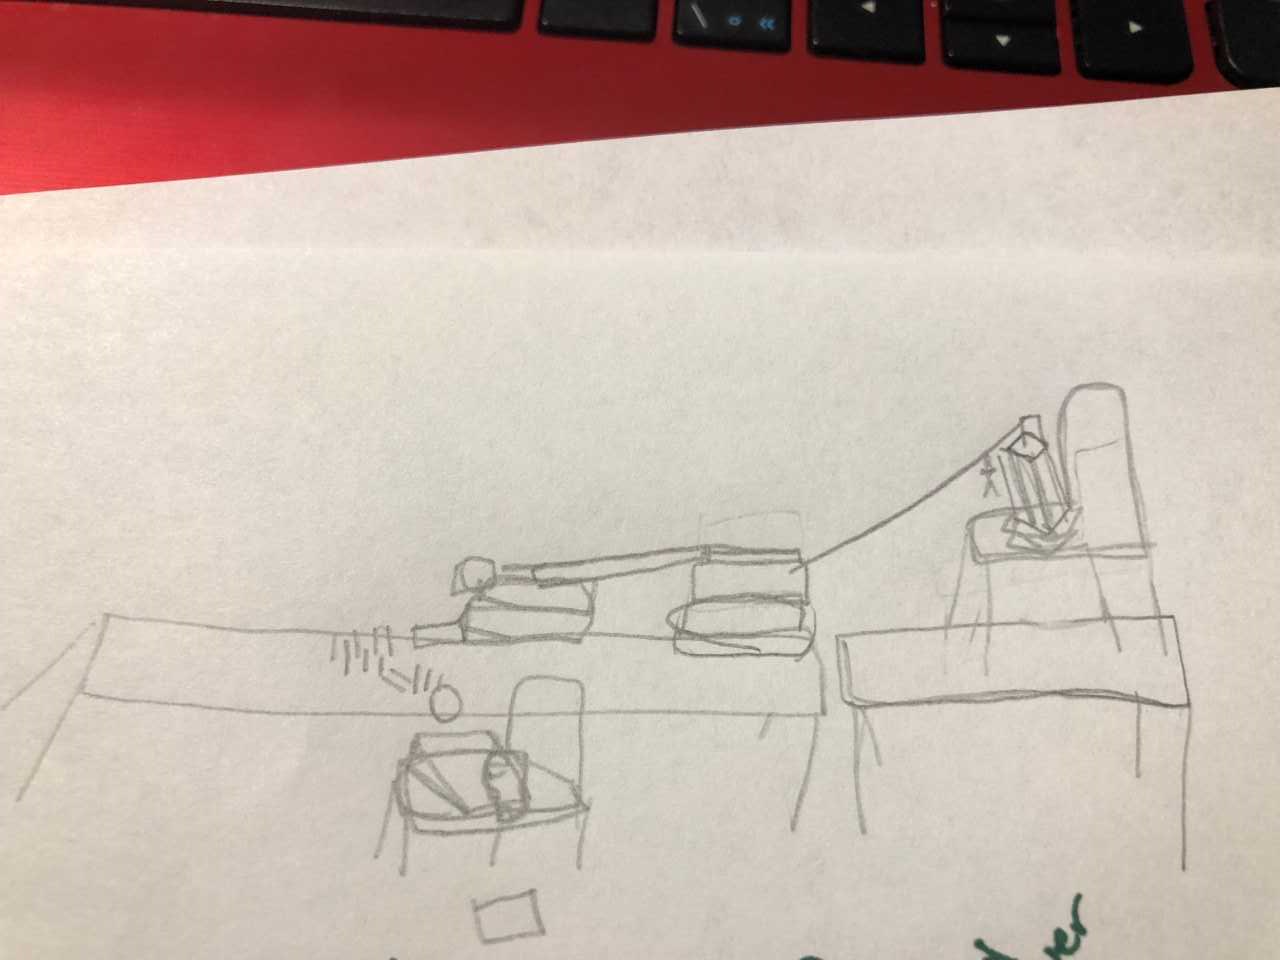
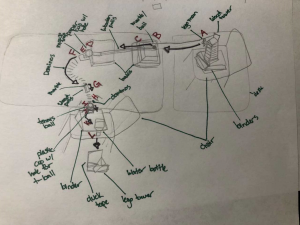
A little lego guy (A) is released from a wooden tower down a zip line and hits the marble ball (B) down the wooden ramp (C) after the ball goes to the end of the wooden ramp it will fall into the paper cup (D) and will come out the bottom which will make it land on the set mous trap (E) once the mouse trap goes off it will hit the dominos (F) and they will all fall which will cause the marble (G) on the wood ramp to roll down and hit the next set of dominos (H) once they go off they will cause the tennis ball (I) to fall into the plastic cup (J) and out of the bottom hole onto a binder/ ramp (K) which will then hit the upside down bottle (L) at the end forcing it to be hit off the chair and onto the ground where the duck tape will catch it and make it land on its cap.
Energy Transfers:
(A) Kinetic to (gravitational) Potential
When the lego man is going down (kinetic) the zip line he stops ( potential) when he hits the marble.
(E) Kinetic to Sound/ Elastic
When the marble falls (kinetic) onto the mouse trap it creates a loud sound (sound).
When the marble falls (kinetic) onto the mouse trap it the spring (elastic) closes the mouse trap.
(G)Potential to Kinetic
When the marble is still (potential) It is then hit by the dominos causing it to move (kinetic) down the ramp.

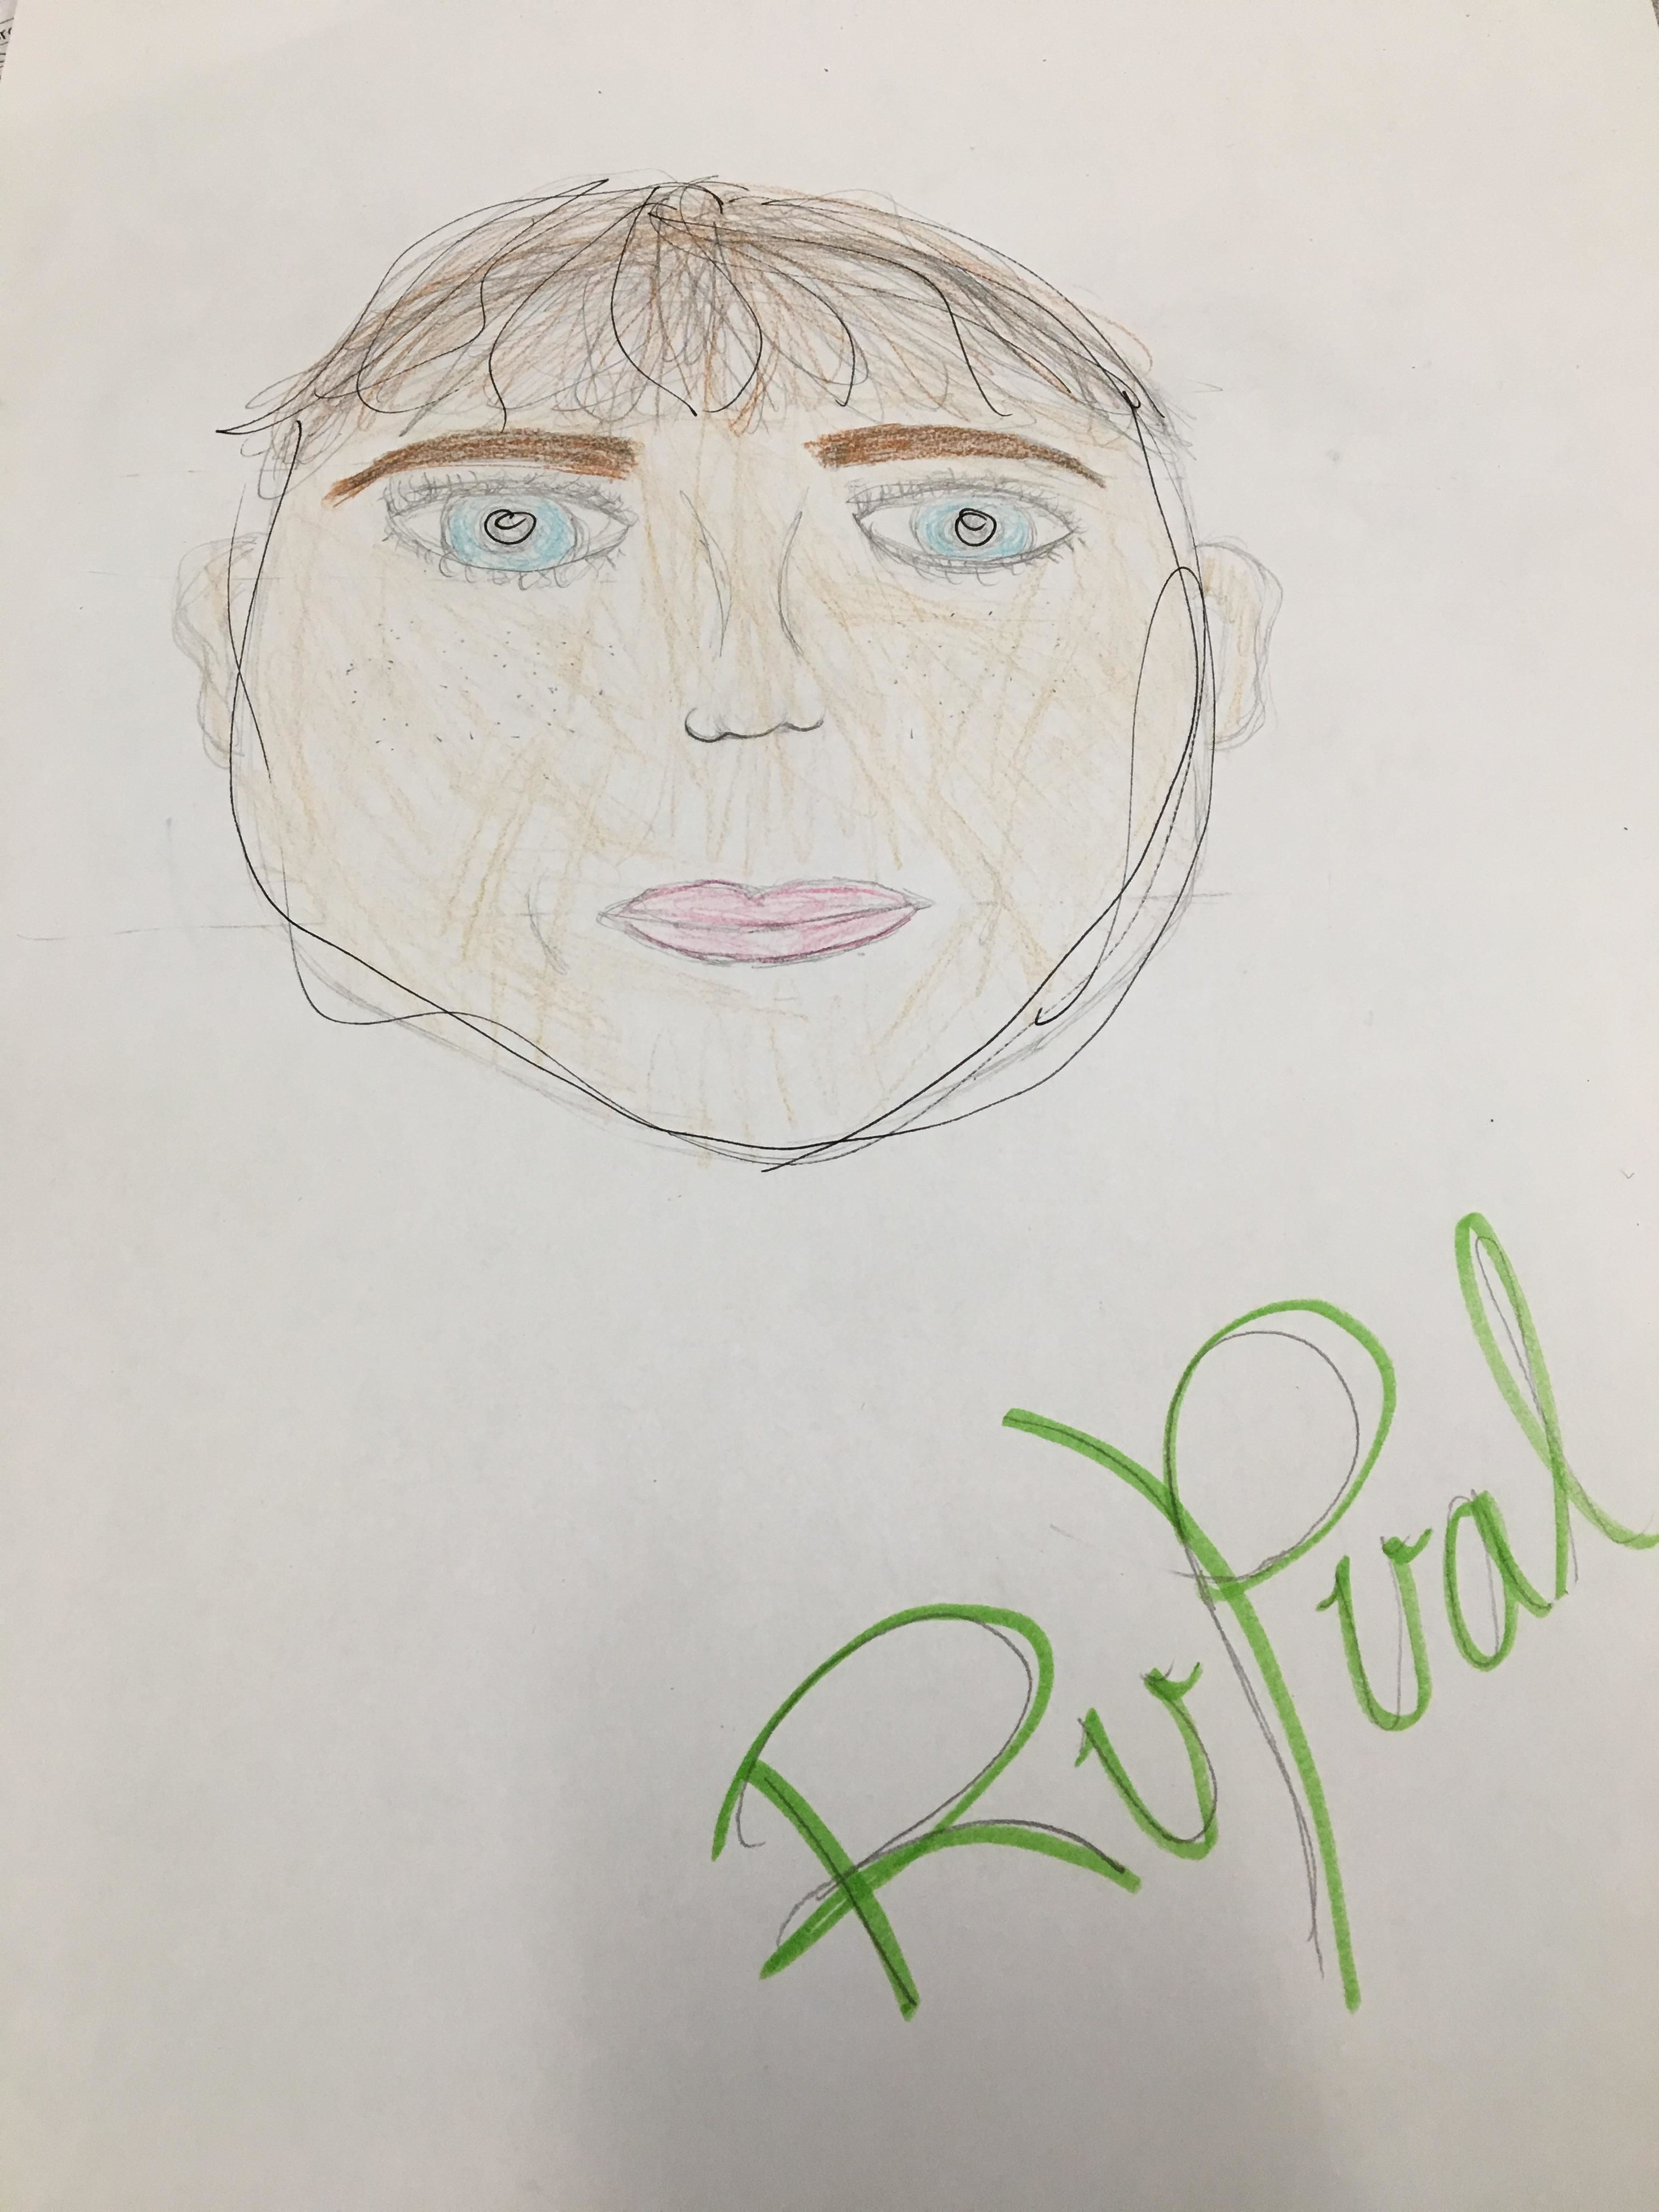
We decided to name our child Rupual, he has wavy medium brown hair, blue large round eyes that are average distance apart, long eyelashes, average sized mouth with thick lips light brown thin eyebrows, freckles on his cheeks, a small rounded nose shape and nostril shape, he has attached earlobes with absent ear points and absent ear pits, his skin color is a light brown.
Answer the following questions:
a. How does the coin flip relate to the probability of inheriting genetic conditions?
It makes the probability exact because you have a 50% chance of inheriting genes from both your mother and father. Shown with the coin flip of you also having a 50% chance of landing on either side.
b. How does this simulation accurately represent or not represent real life?
It doesn’t represent real life because some of the traits listed are not all traits that your real parents would have, and if both parents had blue eyes and the child had brown there is no trace of brown in the ancestry than it wouldn’t make sense, it is represented accurately because there is a 50% chance of receiving the different traits if your parents do have them.
Did you identify any prejudices you might have about what traits you find “desirable”? Where do you think these prejudices come from?
Yes there were certain traits that are more desirable then other, for example I wouldn’t want my child to have a una brow because the stereotypes in the world point them to a negative image.


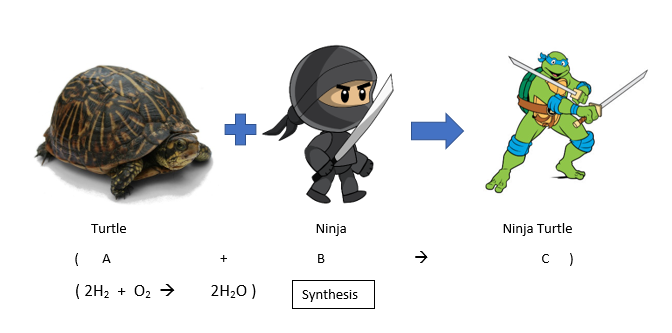
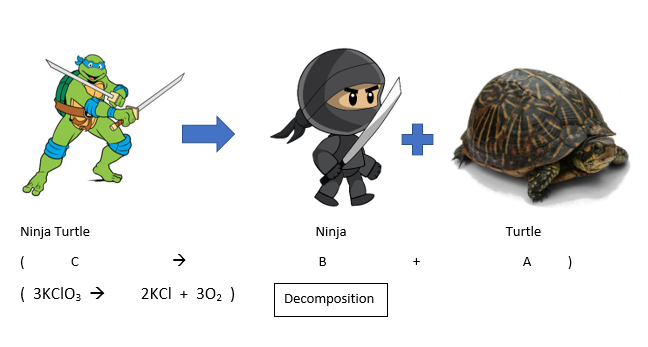
Summary: For this assignement we had to classify different reactions using our own theme, and original ideas. I decided to use the kids show teenage mutant ninja turtles as a inspiration for this project. This assignment helped me to figure out the areas of my comprehension of classifying reactions that I was struggling in and fix them. By doing this assignment it helped me remember what forms of classifying reactions there are (synthesis, decomposition, single replacement, double replacement).

In this experiment we had to build a boat out of aluminum foil, 2 tooth picks, 2 marshmallows and 15cm of tape and we had to count how many pennies we could place on the boat before it sank. We tried to make our boat fancy and we did some origami hoping that a paper boat reference would help us in the process of constructing it. Our hypothesis was that if we create a stable enough boat then the pennies we place gently into the boat will not cause the boat to sink because of the stability and shape of the boat that we constructed. In conclusion our boat contained 20 pennies before it sank, we placed them carefully and equally distributed them across our boat so that one side wouldn’t tip over causing it to sink, we could have improved our experiment by testing different materials and how we constructed it, our hypothesis was supported because we mentioned that the pennies would be able to be placed on the boat without it sinking and it didn’t sink with adding one penny. An error that could have been made during our experiment is how we placed the pennies on the boat because like one of the other groups they placed to many pennies on one side of the boat which made it an uneven causing one corner to sink into the water which the water then leaked into the boat, causing it to sink.

this week in math 10 I wasn’t there for any of the week because I was sick but I learned about elimination and substitution for solving solutions by finding x and y.
With finding the x and y coordinates we learned how to graph them even by just the equation.
We had to use previous knowledge to help us change the equations from general form to slope y intercept form for letting us solve the equations
Two things I did well were my introduction and my thesis, two things I could improve on were integrating my quotes better and my spelling errors.
In week 15 in math 10 we learned how to find the slops of a graph. the slope in this is 2/4 because it rises by 2 and runs by 4. And this slope is a positive slope because its going up. If you do not have an exact rise and run you look for the “nice points” and use those to direct you to find your rise and run.
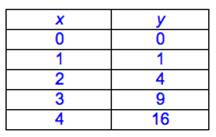
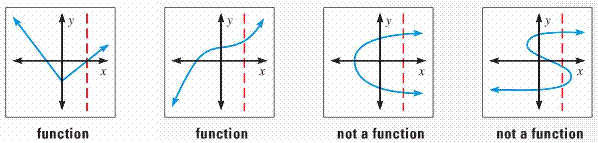
In week 14 of math 10 we learned how to tell the difference between a function or a relation just by looking at a graph, mapping diagram or a table chart.
graphing: If there are dots that have the filled in circle that are found vertically on the sae x value then that is a relation, if there are two lines found vertically above each other than that is a relation as well.
mapping diagram: If your X values are the same then that is a relation, if they are all different that is a function, the only way for X to have the same values as each other is if the Y values are the same for both.
table chart: If your X values are the same then that is a relation, if they are all different that is a function, the only way for X to have the same values as each other is if the Y values are the same for both.