Alternative assignment to peer tutoring
Linear relations
Video 1: https://youtu.be/1xfbBHE3UCA
In this video it is explaining how you can take an increasing or decreasing patteren and put it into a chart, representing a constant change in the independnt and dependant variable. They are showing you how you can take constant patterned information, chart it and turn it into an expression which you can then follow to continue the pattern. For example they use the relation between the distance a car is going and the cost of gas per that distance.
Video 2: https://youtu.be/MweKCXkZ1GA
This video is similar to the last video but it has more of an explanation of y=mx+b and he explains more about what each part of that expression represents. M=slope b=y-intercept. He also explains what that means into further detail as if you were learning linear relations for the first time. He does more exmples with finding x and y and graphing it rather than charting it using different examples with different variables.
Linear equations and innequalities
Video 1: https://youtu.be/bAerID24QJ0
This video starts off by demonstrating how isolate x/find x in a simple linear equation. He also shows you how to deal with an equation if it is involving fractions, he shows you that expressing linear equations with fractions is the same thing but you multiply by the reciprocal to isolate the variable. He also demonstrates how you can check your final answer by substituting x.
Video 2: https://youtu.be/0X-bMeIN53I
This video is based on linear inequalities, he first explains what a linear inequality is. Then he tell you a very important rule, that when dividing by a negative number you must flip the inequality. He then gives an example of what that means. Throughout the video he goes on explaining more concepts and steps, he then demonstrates examples. Unfortunatley he does not explain the 3 steps of checking your answer, his video is more based on making sure you know the rule of flipping the sign and examples being demonstrated and solved.
Scale factor and similarity
Video 1: https://youtu.be/XtkU4VkWh8I
He begins with defining what scale factor is, he then demonstrates how to calculate it and how to use it. He explains all of the terminology he uses to a better, simple understanding. He first changes the values so that they are in the same units, then compares the larger image to the smaller image, he demonstrates how to fin =d the scale factor by comparing the values of one object to the other. He demonstrates cross multiplication to find the unknown length.
Video 2: https://youtu.be/FmZ2sKDb2SI
This video is only 1 of 8 on this topic, but he begines by explaning what similarity is. He explains that with similarity the corresponding angles are equal and that the corresponding sides are in proportion. He then demonstrates examples in order to explain what that means. He explains that the objective of similarity is to find the scale factor. He shows how to use scale factor to find side “x” based on similarity. He also explains cross mutiplication to find the missing length of an object
Year end reflection
During this semester i learned how to identify different types of patterns and themes in poems, how to write with better detail so that the reader can get a better understanding and visualization of what’s happenning, and how to make good in depth connections to a book, to the world, or to the enviroment.
My favourite memory was when we were all gathered in a circle and we played games where we had to do an action to pass on to the other person, i found that alot of fun
Next year i’ll make sure i tripple check my work for even the smallest grammar mistakes and ask more questions to get a better understanding
Hubbard2017DAReflections
After reading the first article it made me realize how dangerous social media really is. There are lots of fake accounts out there that are being used for various things, and alot of people tend to believe whatever they read on the internet. After reading this article i will definitly try and be more careful and not believe every single thing i see or read off of the internet because there is a possibility it could be a scam, it made me more aware of how social medias can affect a person or multiple people if they are targeted by it.
the second link has given me a reminder that alot of information on the internet is fake or not 100% true and that if i wan’t to believe that something is 100% true, then i should research more about the topic and see if i get the same results on more than one website. Also i really dont like the fact that people had posted tragedies that were made up to get a form of attention.
Both of these links have a large affect of me because social medias are a big part of my life and generation and to think that i cannot rely on something so big puts an impact on me because then i think well what’s the point of social medias then?
Statistics
statistics play a large role in our society, the role of statistics is used in many ways and can affect the way we make decisions. It is a way of having a source of knowledge on whether we could do one thing or another. For example if you were to move to a city, the crime rates and average house costs would help your decision. Statistics can also be used in something as simple as at McDonalds, whether the company is going to keep a certain meal based on the averages of costumer likes and dislikes on the product. Statistics are a way of simplifying knowledge on the topic so that the information and facts can be read easier.
After reading this article i have learned more about the importance of the role of statistics in our society such as in general information or more in depth topics. Statistics are invloved in most of the things that take apart in our decisions in our everyday life. Whatever buisnesses, textbooks, people and especially the internet tell you, it’s all based on statistcs. However statistics cannot always be 100% reliable and can be made up easily. There can be bad sampeling, misleading statistics or even unfair poll questions that can be minipulated by the asker in order to get the answer they are looking for. Therefore statistics are not always reliable and we should not let them fully take over our decisions, we should take some time to analyze everythng ourselves so we can have a better understanding and see if what other people are saying actually makes sense.
it10 powerpoint
This is the “Creating website mockups with powerpoint.” I did my website on a women’s clothing store called Aritzia, I had the website so after clicking each item there was an option to “add to bag”. I included 5 ands and new clothing. I also made sure I included a mouse over for brands.
I learned how to make powerpoin so you could interact with it, how to have it so if I click something it will go to the set slide, and how to have it so if I scroll over something a pop up will appear.
I am proud of the final outcome, I think its cool how you can set powerpoint to do certain things and there are so many things you can do with it. I’m happy with how it came out because I enjoyed this project and put a lot of effort into it to have it done on time
IT10 blender
This project is the “Blender toy” animation project, I created a wooden plane as my toy, then a simple scenery. A runway with a building as the airport, then some mountains in the back. for this animation I had hoped to make the plane fly then crash but I couldn’t get the computer to cooperate with the crashing part and couldn’t get it to work. so the plane flew, bobbled a bit then just flew down into the building.
I learned how to resize, rotate, scale and move objects to make different shapes, how to add texture and colour to those objects, and how to create a bit of mountain in the background so it wasn’t just plain flat. I also learned to use animation to move blocks to a certain point.
I am proud that I was able to use blender to a certain point because when I first looked at it, I had no idea how anything worked and I didn’t think I would be able to somewhat complete this project

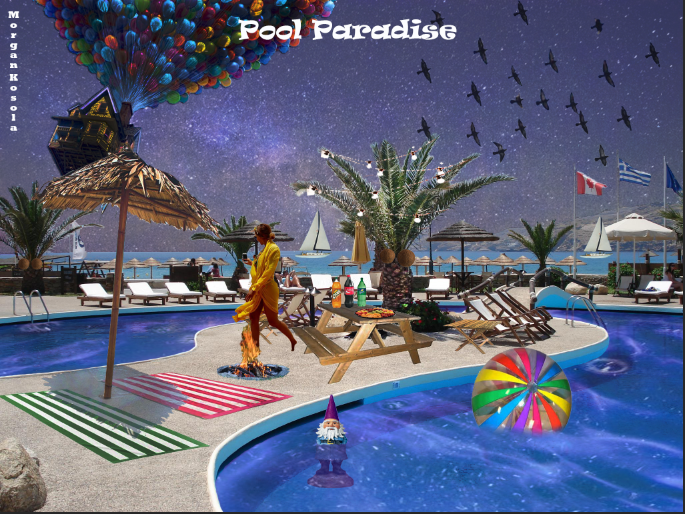
IT10 photoshop
This project is the “create your own scene” photoshop assignment, I started with a simple picture of a pool, then I added accessories to the pool and the deck. I added towels, tables, chairs, food, beach umbrellas and a campfire. I also added a tint to the water, added a space like sky and added the balloons from the movie ‘Up” for the 3 in usual objects.
I learned how to do a lot in photoshop throughout all of the photoshop assignments, I learned how to blend things together, smudge edges to make them appear softer, remove backgrounds, add filters and a lot more.
I am proud of the final outcome/mark and the fact that I managed to finish it on time and have it handed in.
What’s in my junk food? Food 10
A kit Kat blizzard from DairyQueen is probably my favourite junkfood, i like it because it has the right amount of crunchiness to it, and it’s a nice treat that i can eat no matter the weather. However, it isn’t the most nutritious thing i could eat, in a small size it has about 630 calories and 21g of fat, it also has a high amount of socium and a low amount of fiber and vitamins
May lab reflection foods 10

I chose to do a reflection on this lab because it was a lad that i didn’t thik i would like but i did in the end. I enjoyed this lab because i like the creativity of doing rollups instead of just plain lasagna, i also didn’t think i would like this lab but i ended up enjoying it. I didn’t really have expectations for this lab because lasagna isn’t usually my favourite food, but i did like the results of how it turned out. My group worked well during this lab and everything went as planned. If i were to do this lab again i would maybe add vetables to make it healthier ex spinach.