week 14 in math 10
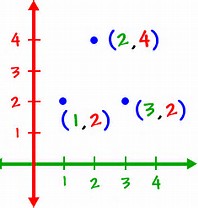
this week in math 10 I learned how to identify if a relation is a function. I learned that for a relation to be a function, it basically means that the input must have only have one output. on graph, a function would not have any dots sitting directly above each other:
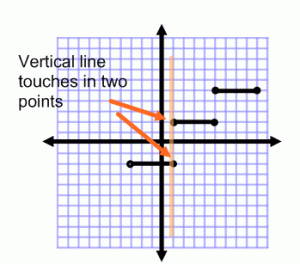
where as in this graph does not represent a function because there are two points vertically above each other
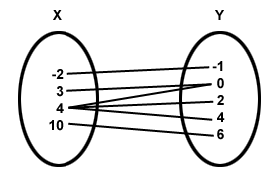
you can also represent functions through mapping diagrams, a mapping diagram uses arrows to connect the inputs with the outputs, an example of a relation that is not a function would be this because 4, as you can see has arrows to three different outputs.
however this diagram represents a function because it is showing that every input number only has one output/one connecting arrow
week 13 in math 10
this week in math 10 I learned how to write an equation for y by looking at a set of numbers and using a T chart. for example this set of numbers:
-5,-2,1,4,7,10,13,16
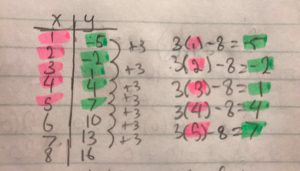
we would draw out a T chart with the left side as X and the right side as Y. x being the input, y being the output. then under the X we would write 1,2,3,4….. and under the Y we would write our -5,-2,1,4,7,10… now we have to find a rule that will get the X number to the Y number, that will also work for all of the numbers. so 1 to -5, 2 to -2, 3 to 1, 4 to 4, 5 to 7 and so on. we can write the pattern of the numbers along with the starting point “start at -5 increase by 3 each time.” because its increasing by 3, we multiple 3 with X and then add/subtract a number to get Y. y=3(x)+or-#
replace x with a number 3(1)= 3 and we have to get to -5 so the equation would be 3(1)-8=-5. we can check if 3(x)-8 works for all the pairs of numbers by replacing X and if it does then the rule for this pattern would be 3(x)-8


