Everyday Acid Lab

Purpose: To find the pH and concentration of acid

Materials:

  • 50 mL water
  • 5.70g of nerds (Malonic Acid)
  • 30 mL of sample
  • phenolphthalein
  • Stir stick
  • Graduated cylinder
  • 3 funnels
  • 3 filer sheets
  • Erlenmeyer flask
  • 3 beakers
  • Ring stand and mixer
  • 15 mL of 0.10 M NaOH

Procedure:

  1. crush nerds into a fine powder. Measure mass and record.

2. Dissolve powdered nerds in 50 mL of water and mix with a stir stick.

3. Place filter sheets in the funnels and filter the acid solution.

4. Measure out 10 mL of the acid solution.

5. Add two drops of phenolphthalein to 10 mL of solution.

6. Titrate 10 mL of solution by adding 0.10 M NaOH.

7. Continue to add NaOH until ppt begins to turn pink, thus indicating the solution is neutral. Repeat 3 times.

8. Record how much of the basic solution was added.

Data:

Trial # Volume of Acid (mL) Volume of NaOH (base) (mL)
Trial 1 10 mL 5.40 mL
Trial 2 10 mL 4.60 mL
Trial 3 10 mL 4.60 mL
Average Volume 4.87 mL

Calculations:

since two of the trials had the same volume of NaOH used, we only wrote two equations.

Conclusion:

In conclusion, we found that acids are a recurring part of our daily lives. It was surprising to us that the candy had a fairly low amount of a strong acid. We found the concentration of our acid by diluting it in water and filtering it. We then used titration to help us find the pH of the candy. The phenolphthalein was an important aspect that informed us when our solution was neutral by turning pink. We used the M1V1 = M2V2 formula in order to find the concentration of hydronium ions, helping us find our final pH. Our final pH was between 1.45 and 2 which makes sense since the pOH of the base is about 13.

Experimental Design – Enzymes v.s. Temperature

By: Keisha N, Yinling C

Purpose: To determine the effects of temperature on the reaction rate of the enzymes reactions

Hypothesis: The high temperature will cause a higher reaction rate causing more glucose to appear.

When heated above 45 degrees the protein will denature and there will be no glucose. The lower temperature will cause a slower reaction rate causing less glucose to appear.

Materials:

  • Lactase enzyme drops
  • (lactose) Milk (100mL)
  • 1L of water
  • 5 Glucose test strips
  • 5 Test tubes
  • Test tube rack
  • 1 stir stick
  • Thermometer
  • Bowl of ice (ice bath)
  • Heat source (hot water bath)
  • Three beakers

Procedure:

  1. Fill one beaker with 500mL of water and place on the hotplate (medium – high heat)
  2. Fill the second beaker with 500mL of ice water (ice water bath)
  3. Fill each of the test tubes with 20mL of the lactose milk
  4. Add 2 drops of lactase enzyme drops to each of the test tubes
  5. Take one test tube and place it in the test tube rack to act as the control group, Make sure it is at room temp (23ºC).  Keep for 10 minutes.
  6. Take one test tube and place in the ice bath once it has dropped to 15ºC. Place in the bath for 10 minutes making sure that the temperature stays within close range.
  7. Take the third test tube and place it in the hot bath once it has reached 28ºC, leave the test tube in the hot bath for 10 minutes. Check temperature range regularly.
  8. Once 10 minutes has passed, take the test tubes out of the baths. Place a sample from each test tube on the test strips. Record colour. Repeat for beakers with body temperature and for 45ºC.
  9. Take the fourth test tube and place it in the hot bath, once it has reached body temperature (37ºC),  leave the test tube in the hot bath for 10 minutes.
  10. Take the last test tube and place it in the hot bath once it has reached 45ºC, leave the test tube and place in the bath for 10 minutes.

Data and Observations:

Beaker Temperature


Colour of the Test Strips Presence of Glucose (mmol/L)


1 15ºC Green 14 mmol/L
2 Room Temperature (23ºC) brown

Olive Green

56 mmol/L
3 28ºC


Light Brown 56 mmol/L
4 37ºC Light Dark Brown 111 or more mmol/L
5


45ºC Brown 111 or more mmol/L

Questions:
 1. At what temperature was there the lowest count of glucose? – Why?

The lowest amount of glucose was present at 15ºC. This was because when you lower the temperature of the milk it causes the reaction rate of the enzymes to slow down, causing there to be less glucose present.

2. What would happen to the enzymes if it were placed into a test tube with a temperature higher than 45ºC?

If placed in a test tube above 45ºC there should be no glucose present in the milk. This is due to the fact that when an enzyme is heated to above 45ºC, the enzyme will start to denature, causing there to be no trace of glucose.

3. Why does 37ºC (body Temperature) produce the most optimal conditions for enzymes to work in?

As the temperature rises, reacting molecules have more kinetic energy; this increases the chances of successful collisions and thus, the reaction rate increases. At 37ºC, the enzyme’s catalytic activity is at its greatest and therefore making it the most optimal temperature for the human cell.


Conclusion:

This lab allowed us to determine the effects of temperature on the reaction rate of the enzymes. We had hypothesized that there would be little to no glucose present when the temperature of the milk was lowered and that there would be high amounts of glucose when the temperature was raised, our hypothesis proved to be correct. We also predicted that no glucose would be present at 45ºC which was proven wrong. The incorrect hypothesis could be due to an error during the lab. At the lowest temperature (15ºC) there was little to no glucose present due to the low temperature and slow reaction rate. At he high temperatures we found that like we had hypothesized we found that there were high amounts of glucose present due to the high temp. and the increased reaction rate. When we had heated up the milk to 45ºC, the enzyme was supposed to denature however, due to error this was not the case. The most glucose was present at 37ºC and 45ºC. This lab gave us the ability to learn more about the relationship between temperature and how it effects enzymes.


Errors/Improvements:

To improve our lab design, we would have kept the amount of tests that we did however change the temperatures at which it happened. We tested too many temperatures that were in the same range and not much of a variety. We should have done at least another test at a very low temperature and one above 45ºC. It was also difficult for us to maintain a constant temperature causing there to be an error in our lab. The enzyme should have denatured once heated to 45ºC or higher.


Diffusion in Agar Cubes

Purpose: What determines the efficiency of diffusion throughout the model “cells”?

Hypothesis: The smaller the surface area and volume, the higher the rate of diffusion will be.

1 cm cube of agar

2 cm cube of agar

3 cm cube of agar

Cut agar cubes after being in base solution for 10 minutes

Close up of cut agar

Data Table

1. In terms of maximizing diffusion, what was the most effective size cube that you tested?

In terms of maximizing diffusion, the most effective cube that was tested  was the small, 1cm cube of agar.

2. Why was that size most effective at maximizing diffusion? What are the important factors that affect how materials diffuse into cells or tissues?

This size was most effective at maximizing diffusion because its surface area is proportionally larger than its volume, which can be seen through the surface area to volume ratio, 6:1. The smaller surface area and volume, the easier it is for diffusion to occur. Some factors that affect diffusion are: temperature, surface area, volume, and the size/shape of the molecule.

3. If a large surface area is helpful to cells, why do cells not grow to be very large?

A large surface area is helpful to cells as it allows for more materials to enter the cell, however, a smaller surface area is also helpful as it allows for diffusion to occur at a faster rate, and move towards the center of the cell faster. When a cell grows its volume increases at a greater rate than its surface area, causing diffusion to happen at a slower rate, thus, decreasing growth.

4. You have three cubes; A, B, and C. They have surface to volume ratios of 3:1, 5:2, and 4:1 respectively. Which of these cubes is going to be the most effective at maximizing diffusion? How do you know this?

Cube C would be the most effective at maximizing diffusion. This is due to the fact that the surface area to volume ratio (4:1) contains a surface area that is proportionately larger than the volume. There is more surface area to be diffused but, the smaller volume allows for diffusion to travel and reach the center of the cell quicker.

5. How does your body adapt surface area-to-volume ratios to help exchange gases?

Our lungs contain sacs known as Alveoli. These sacs have a large surface area to volume ratio due to their folded shape, causing diffusion to happen more quickly. Each sac contains a thin wall which increases their surface area and makes it easier for them to deal with any inflation that may occur in the lungs. This also decrease the amount of volume that diffusion needs to act upon.

6. Why can’t certain cells, like bacteria, get to be the size of a small fish?

Certain cells can’t get to the size of a small fish as it wouldn’t be practical for them. It will make it harder for cells to diffuse materials that well. The cells are small to begin with as it allows for diffusion to occur at a much greater rate. Increasing the size of the cells would only slow down the rate of diffusion for the cell.

7. What are the advantages of large organisms being multicellular?

Some of the advantages of large organisms being multicellular is that they grow. Single celled organisms can only reproduce and make more copies of themselves, they are not capable of growing. Another advantage is that due to them being multicellular, they can have multiple functions, making them more efficient.

Measuring Keq Lab

Part I:  Preparation of a standard absorption curve for FeSCN+2

Standard 0.20M Fe(NO3)3 0.0020 M KSCN 0.100M HNO3 [FeSCN+2] Absorbance
A 10.0 mL 0.0 mL 15.0 mL 0 0
B 10.0 mL 1.0 mL 14.0 mL   M 0.343
C 10.0 mL 1.5 mL 13.5 mL  M 0.518
D 10.0 mL 2.0 mL 13.0 mL  M 0.706
E 10.0 mL 2.5 mL 12.5 mL  M 0.860
F 10.0 mL 3.0 mL 12.0 mL  M 1.130


EQUATION:

Y : 4572.1x – 0.0068 | 


Part 2: Measuring Equilibrium

Test Solution 0.0020 M Fe(NO3)3 0.0020 M

KSCN

0.10 M

HNO3

Initial [Fe+3] Initial [SCN] Absorbance Equilibrium

[FeSCN+2]*

I 5.0 mL 0 5.0 mL  M 0 0 0
II 5.0 mL 1.0 mL 4.0 mL  M  M 0.174
III 5.0 mL 2.0 mL 3.0 mL  M  M 0.370
IV 5.0 mL 3.0 mL 2.0 mL  M  M 0.512
V 5.0 mL 4.0 mL 1.0 mL  M  M 0.696
VI 5.0 mL 5.0 mL 0.0 mL  M  M 0.836


ICE Charts

Test Solution

Keq = 260

Fe3+               +                SCN–                                FeSCN2+
I 0
C –  –  +  
E      


Test Solution

Keq = 280

Fe3+               +                SCN–                                FeSCN2+
I 0
C –  – 
E      


Test Solution

Keq = 260

Fe3+               +                SCN–                                FeSCN2+
I 0
C –  – 
E      


Test Solution

Keq = 290

Fe3+               +                SCN–                                FeSCN2+
I 0
C –  – 
E      


Test Solution

Keq = 280

Fe3+               +                SCN–                                FeSCN2+
I 0
C –  – 
E      

CONCLUSION AND EVALUATION:

  1. Comment on your Keq values.  Do your results convince you that Keq is a constant value regardless of the initial concentrations of the reactants?  Why or why not?The results of our Keq values convinced me that Keq is not a constant value. Our values jumped around between 260 and 290, leading us to the conclusion that Keq is not a constant value and will change if you alter any of the initial concentrations.
  2. Calculate the average value of Keq from your five trials.  The actual value of Keq  for this reaction at 25oC is reported as 280.  Calculate (should you use all of your values?) the percent difference of your average value from the reported value:
    Actual Value: 280
    Experimental Value: 273.91
    % difference: (273.91 – 280) / 280 = 2.17%


Protein Synthesis

DNA backbone (Thymine is represented by the blue beads)

RNA backbone (Uracil is represented by the brown bead)

1.How is mRNA different than DNA?

Although both DNA and mRNA are polynucleotides, they have three distinct differences to one another.

  • Firstly, unlike DNA which is double stranded, long and has a helix; mRNA differs as it is single stranded, short and does not contain a helix.
  • Secondly,  DNA’s nucleotides contain the sugar deoxyribose, whereas mRNA’ nucleotides contain the sugar ribose.
  • Lastly, while base pairing occurs in DNA, Adenine will always pair with Thymine. In mRNA there is no Thymine so instead Adenine will always pair with Uracil in terms of all types of RNA including mRNA.

2.Describe the process of transcription.

Transcription is the process in which one gene’s DNA sequence is copied (transcribed) onto a strand of mRNA. It occurs in 3 phases: Unwinding & unzipping of DNA, complimentary base pairing with DNA, and separation from DNA. All phases are in occurrence due to the enzyme RNA polymerase.

DNA being unzipped. A process that is facilitated by RNA polymerase

Phase 1: Unwinding and Unzipping 

  • During the process of transcription, a portion of the DNA helix unwinds and unzips, exposing one gene.

RNA polymerase joining adjacent nucleotides

mRNA molecule constructed

Phase 2: Complimentary Base Pairing

  • Only 1 strand will be used as a template to produce an mRNA strand, this is known as the sense strand. Along the sense strand the complimentary RNA bases will bond together. Since RNA doesn’t contain Thymine, Adenine will pair with RNA’ equivalent base pair: Uracil. The sense strand partners with what is known as the nonsense strand, containing information that is not useful; not yielding a protein, if transcribed.
  • RNA polymerase will join the the adjacent nucleotides to one another using H-bonds. The nucleotides will bond, forming covalent bonds and build an mRNA backbone.

mRNA is detached

DNA reforms its double Helix

Phase 3: Separation

  • Once the entire gene has been transcribed the mRNA strand will detach from the DNA strand. The DNA molecule will rewind itself, reforming its double helix shape. This results in a strand of mRNA that gets modified before it moves out towards the nucleus.

How did today’s activity do a good job of modelling the process of RNA transcription? In what ways was our model inaccurate? 

There were a few ways in which the activity accurately modeled the process of RNA transcription. I think that it accurately displayed how instead of pairing with Thymine Adenine will pair with RNA’ Uracil by the use of a different coloured bead, as well as the difference in their backbones, modelled using a red backbone. I think that it also gave a good representation of how the DNA and RNA bases paired with one another. We also got a good visual on how the mRNA strand and DNA strand separated from one another and how the DNA returned to its double helix shape. I think it painted a good picture of each of the 3 phases of transcription.  There were two inaccuracies that I found with this activity. The activity didn’t show how the mRNA strand is much smaller to the DNA strand; nor did it show what follows after transcription occurs and how the mRNA strand is processed which was shown as an important step.

Describe the process of translation: initiation, elongation, and termination.

Translation is the process in which the code carried by mRNA transforms into a polypeptide. This process of translation occurs in 3 steps: initiation, elongation and termination.

Ribosome reaches the start codon and is instructed to start translating and to code for an amino acid

Step 1: Initiation

  • In an mRNA, the instructions to build a polypeptide come in groups called codons. Codons – 3 letter words located on mRNA.  There are 3 “stop” codons that mark the polypeptide as finished; and one codon, AUG, is a “start” signal that starts of translation.
  • During this stage of translation, mRNA binds to the small ribosomal subunit in the area of the start codon (AUG). The first tRNA pairs with this codon. A large ribosomal subunit and small subunit will then join together.There are two sites in the ribosome in which bonding can occur, the “A-site” and “P-site”. The ribosome will then start to move along the mRNA until it reaches the start codon, AUG, in the “P-site”. This tells it to start translating and code for an amino acid. A matching tRNA will bring in an amino acid that is represented by the mRNA codon.

Amino acids in both the “A” and “P” sites

The tRNA in the “P-site” is released and leaves the ribosome;

Step 2: Elongation

  • A ribosome is large enough were it can contain two tRNA molecules: the incoming and outgoing. tRNA also contains 3 letter codes called anticodons which are complimentary to mRNA codons.
  • During this step the ribosome will hold the mRNA and allow for the complimentary tRNA to attach to the binding sites. As the tRNA binds to the “P-site” , another will bond with the “A-site”. A peptide bond will form between the two amino acids. Thi bond causes the amino acids to let go of the tRNA in the “P-site” and start to bind to the neighbouring amino acids. The “empty” tRNA will then leave the ribosome and as a result the ribosome will begin to move along the mRNA. This is done in order to make the tRNA that contains the polypeptide chain shift over to the “P-site”. Now the second tRNA is at the “P-site” and the new tRNA will start to bind with the mRNA codon at the “A-site”.

tRNA in the “P-site” gets the stop codon and the chain stops growing

Step 3: Termination

  • The elongation cycle will continue until the mRNA reads a stop codon, terminating the process. This would be a 3 letter word (codon) with no matching tRNA amino acid. This means that there are no new amino acids being added to the chain, causing the ribosome to separate into its two subunits and release the polypeptide.

How did today’s activity do a good job of modelling the process of translation? In what ways was our model inaccurate?

The ways that this activity was accurate was that it went through each of the stages carefully, allowing for one to grasp the concept better. We also got to see how the ribosome moves along the chain. I also found it beneficial to see how the codons and anticodons paired with one another. Some things that I found to be inaccurate with this activity was that we weren’t able to model the release factor that bonds to the stop codon and how the polypeptide is detached. I also found that the changing of the tRNA’ shape wasn’t displayed nor was the accurate shape of the amino acids displayed well.


DNA and Protein Synthesis

1. Explain the structure of DNA – use the terms nucleotides, antiparallel strands, and complimentary base pairing.

DNA (Deoxyribonucleic acid) is a large polymer consisting of 4 nucleotides, each made up of a phosphate group, a sugar group (deoxyribose), and a nitrogenous base. Two of which are double ringed (Purines) and two which are single ringed (Pyrimidine).

Purines -> Adenine & Guanine | Pyrimidines -> Thymine & Cytosine
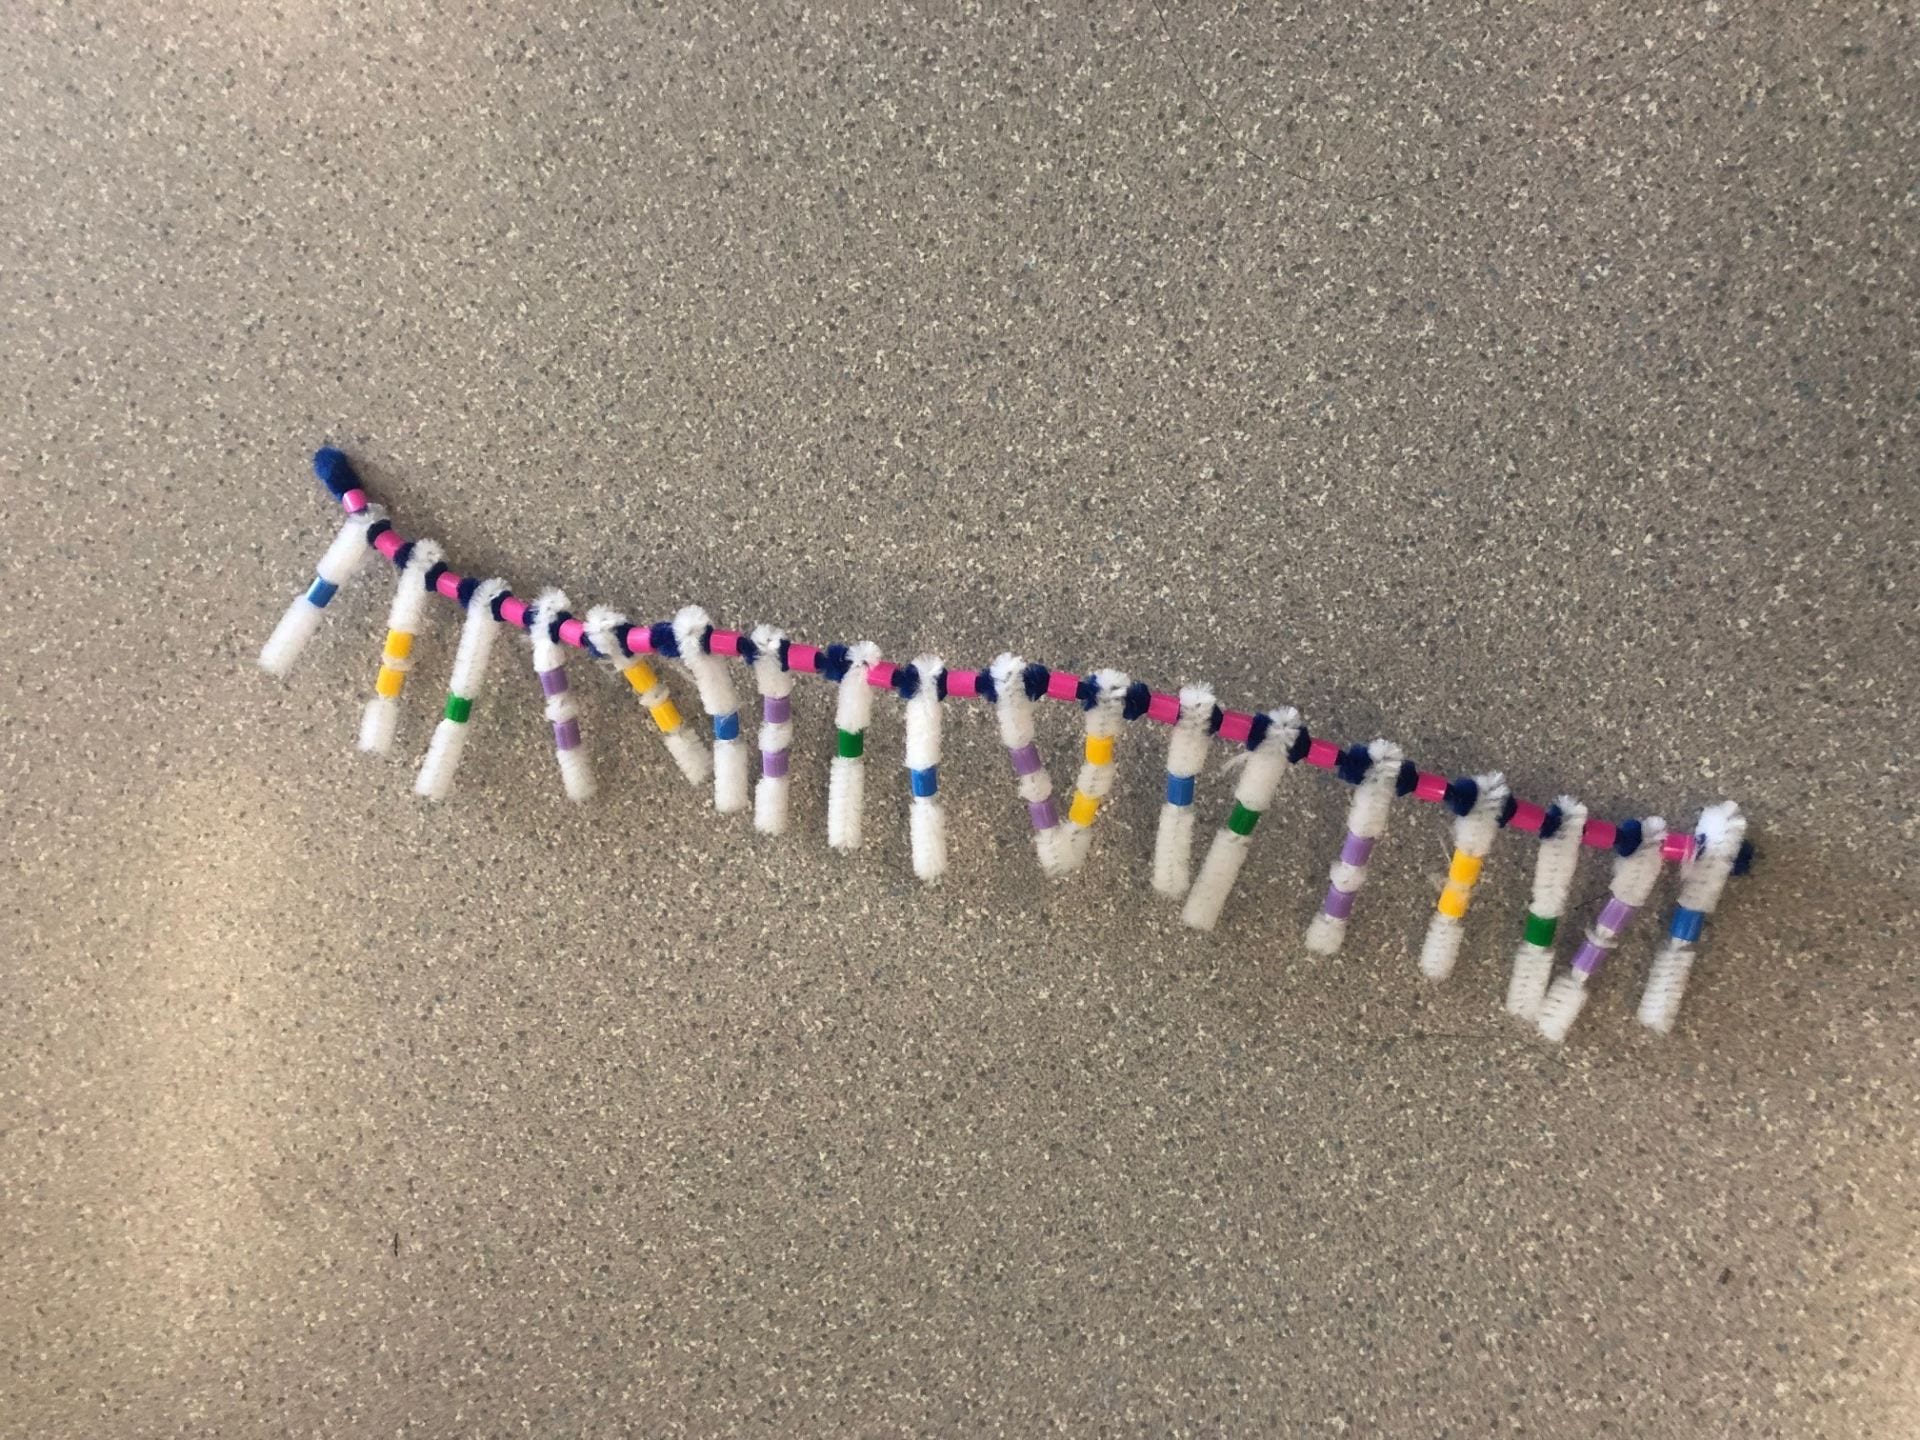
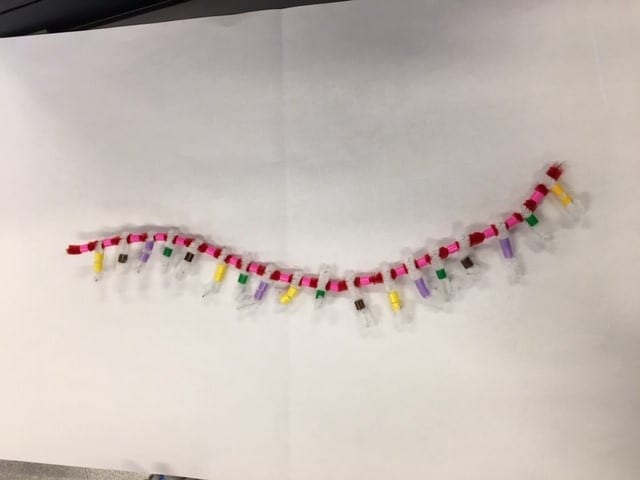
DNA backbone

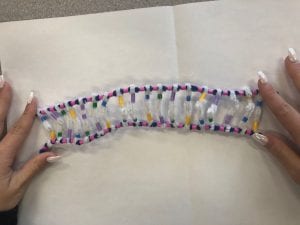
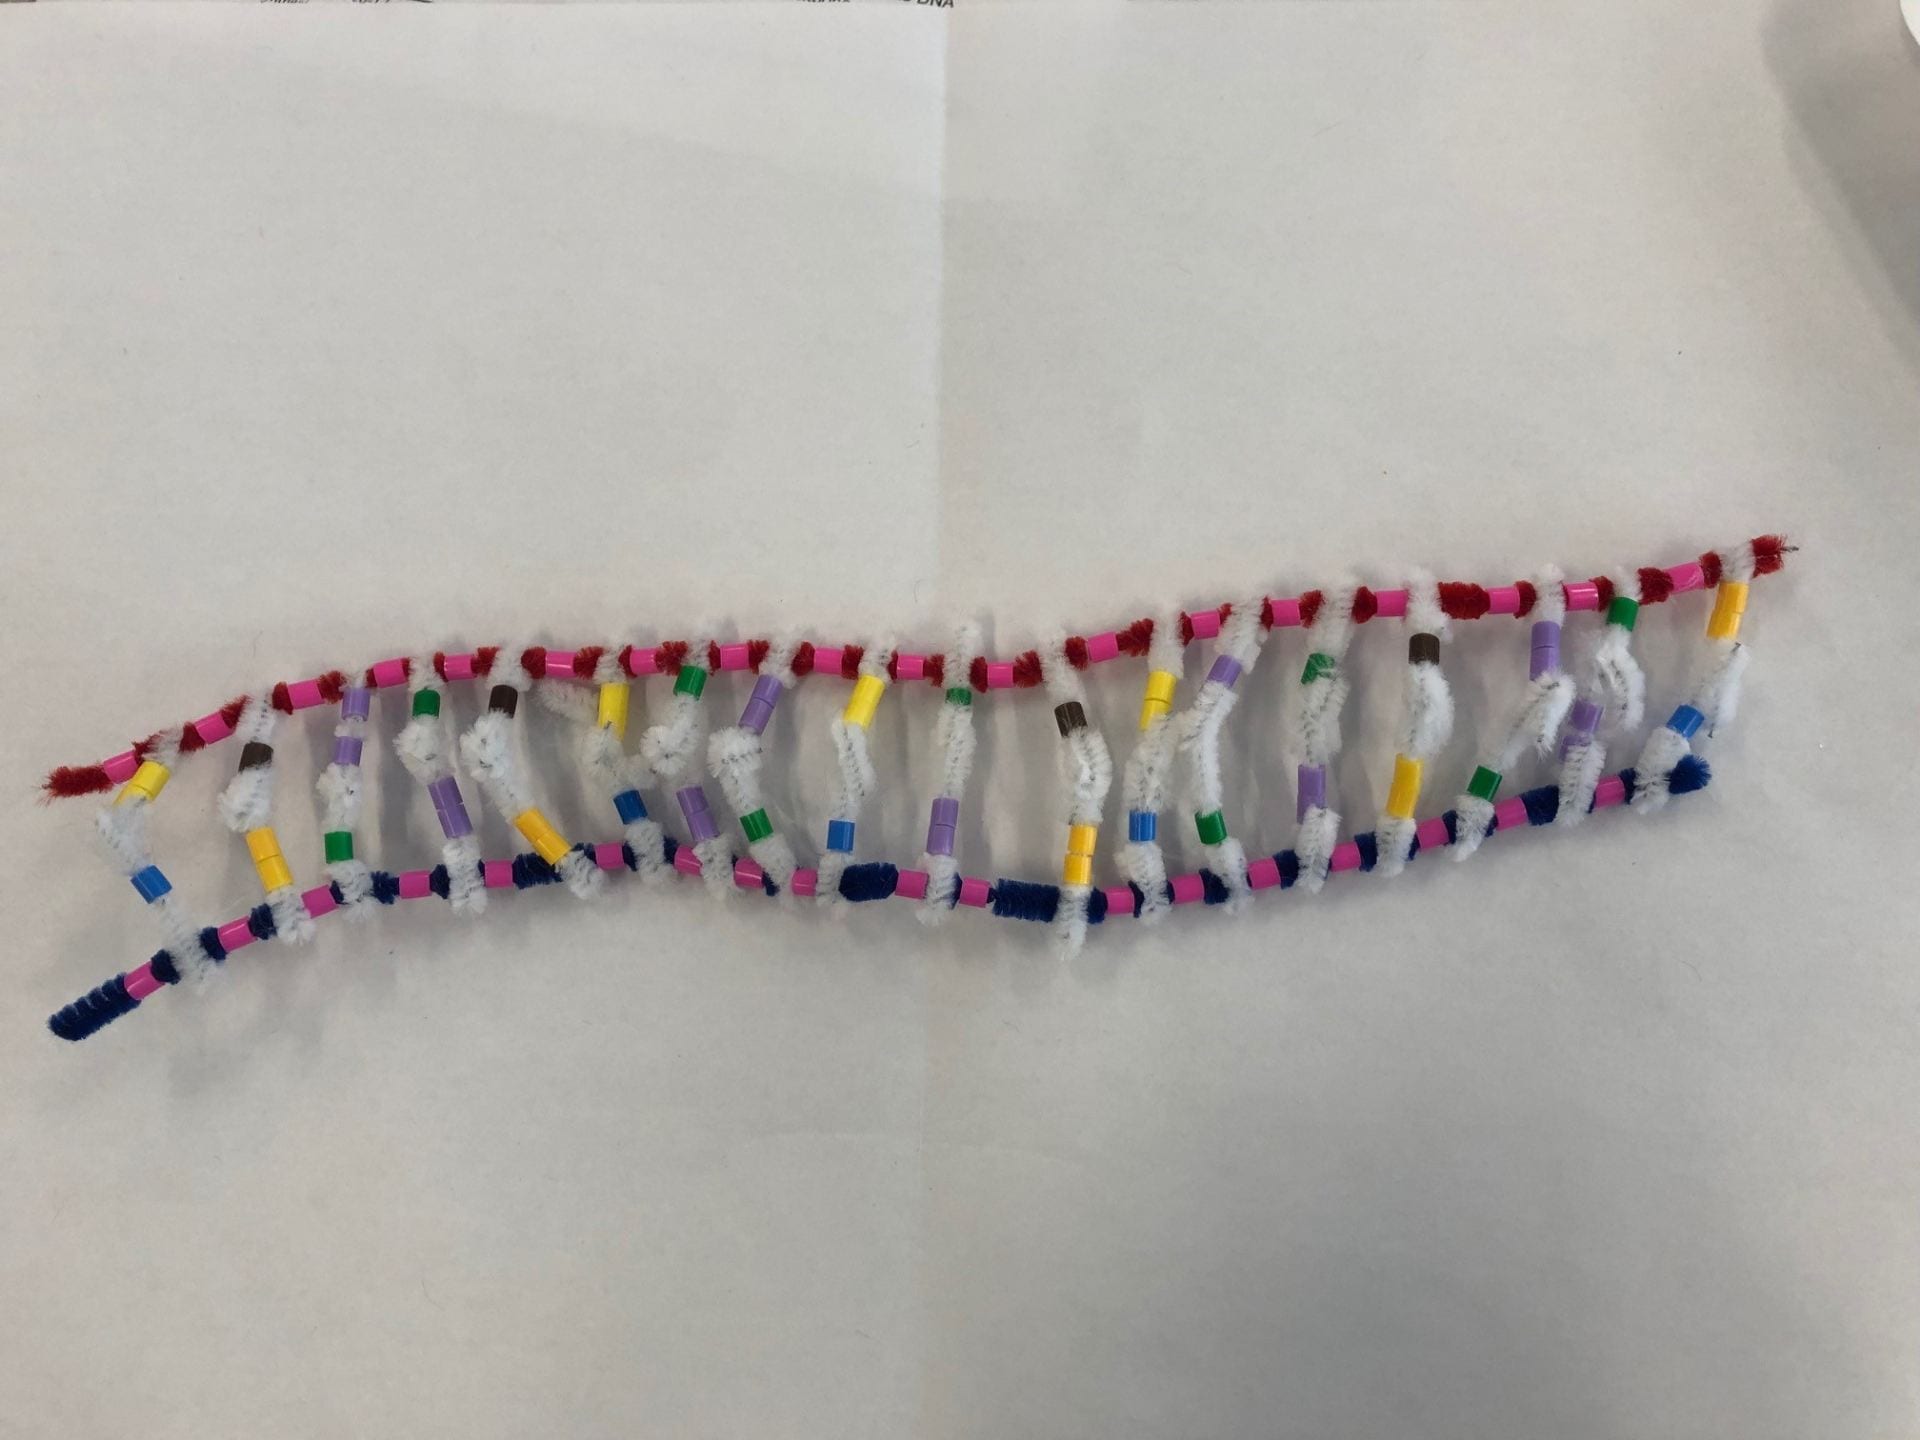
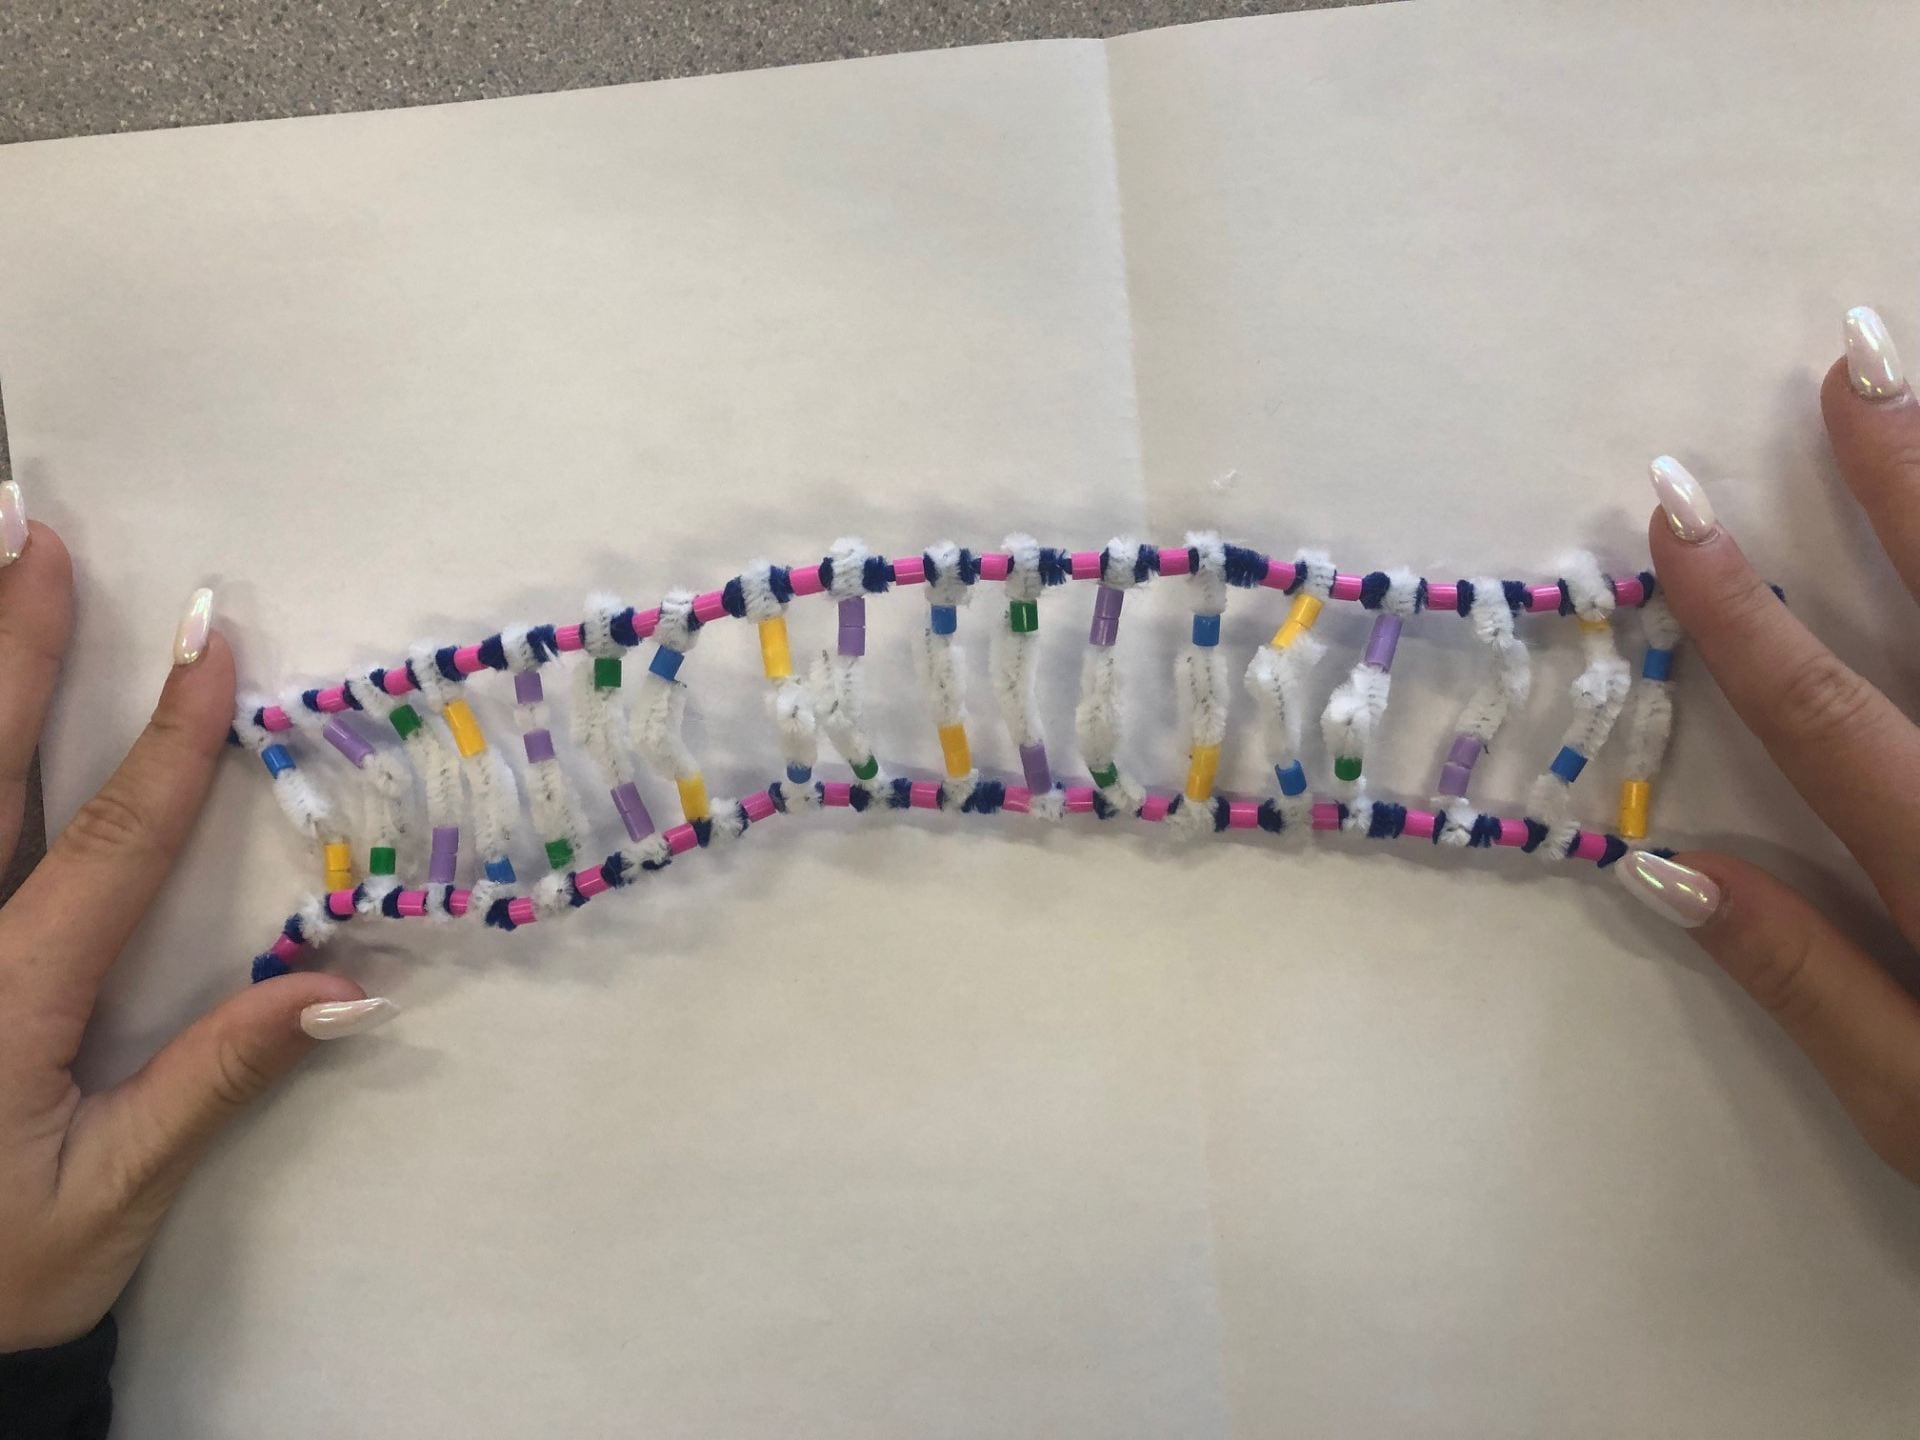
Clear view of DNA structure and base pairing
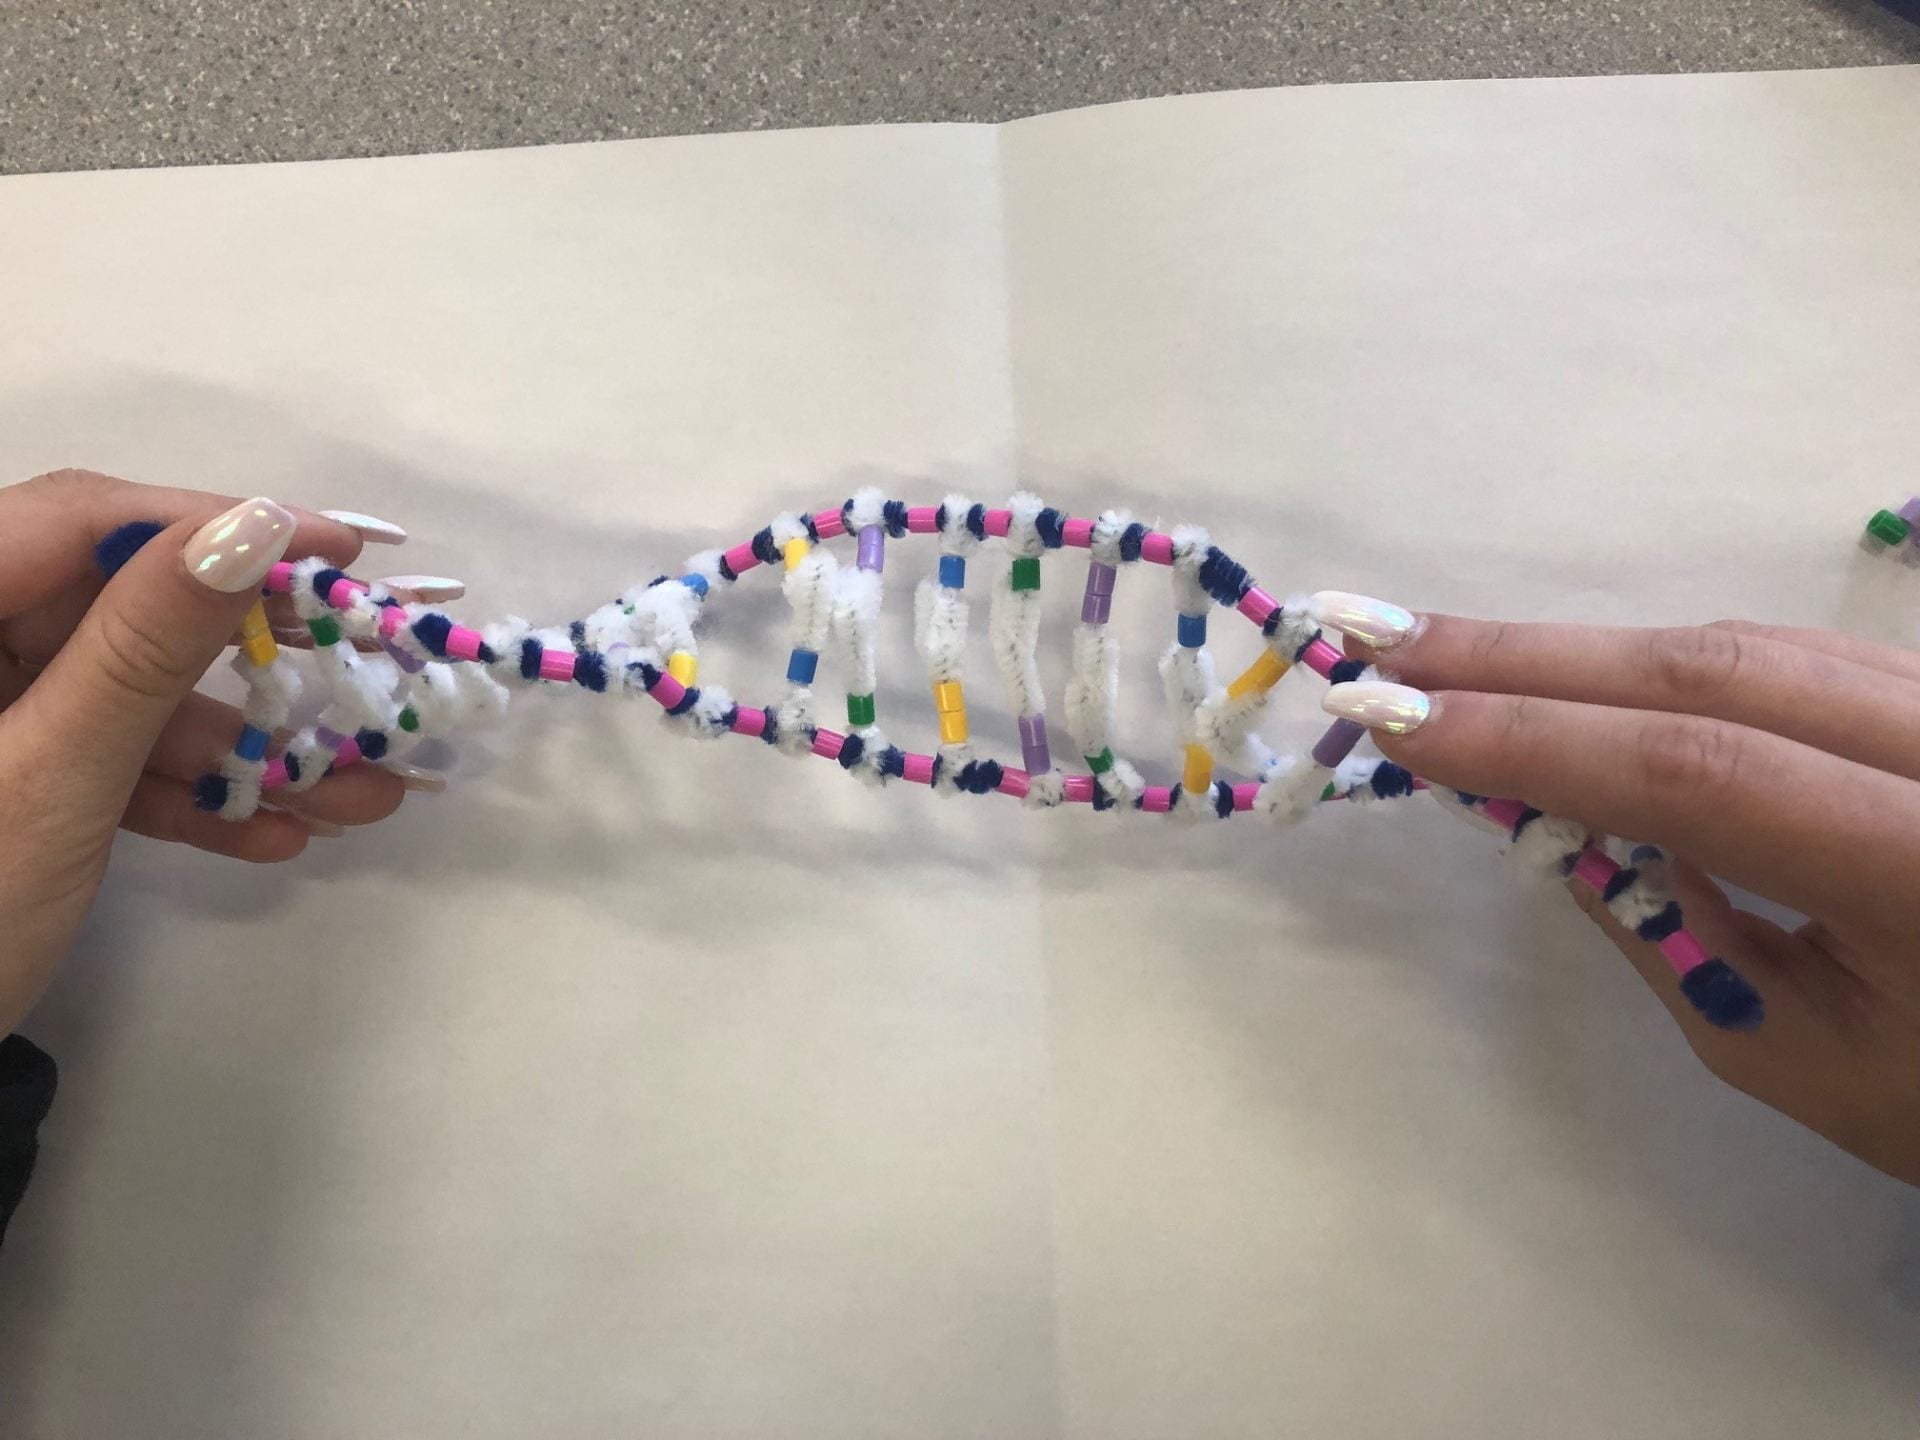
Double Helix

Double Helix

The two backbones of DNA are formed through the bonding of the sugar-phosphate pieces of adjacent nucleotides. The nucleotide bases face “into” the ladder and are formed through H-bonds that lie between the base pairs. The bases attach together in a special way, always with the same partner, known as complimentary base pairing; Adenine -> Thymine & Guanine -> Cytosine. The base pairs form two long strands that spiral, creating a double helix. The two DNA strands are antiparallel, they lie parallel to one another yet are read in opposite directions; and complimentary, this is when the strands give the same message.

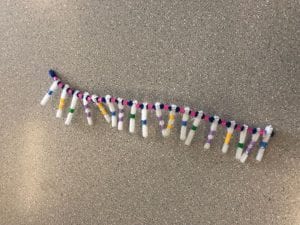
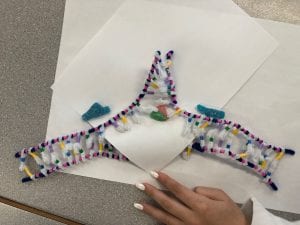
2. How does this activity help model the structure of DNA? What changes could we make to improve the accuracy of this model? Be detailed and constructive.

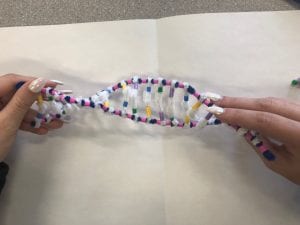
The activity helps model the structure of DNA through the use of pipecleaners and beads to show its different parts. Pipecleaners are used to show both the two backbones as well as for the H-bonds that are formed; beads are used to represent the 4 complimentary bases, as well as the number of rings each base contains. We used two beads for the purines to show their double ring and, one bead for the pyrimidines to show their single ring. The different colours used for the bases help make a clear visual on complementary base pairing. The model we made also accurately demonstrates how the strands are antiparallel to one another. Some changes to make this activity more accurate would be to have accurate measurements included in order to show the spacing between everything on the DNA strands. Another is that the activity doesn’t accurately demonstrate the number of hydrogen bonds that are formed between the base pairs, there could be an increase in the number of white pipecleaners used to show the two bonds formed between adenine and thymine and the three bonds formed between guanine and cytosine.

3. When does DNA replication occur?

DNA replication occurs prior to cell division. It is a semi-conservative process as each new molecule must contain one backbone from the original DNA strand, allowing each new molecule to have the same instructions to make new proteins.

4. Name and describe the 3 steps involved in DNA replication. Why does the process occur differently on the “leading” and “lagging” strands.

DNA  replication occurs in 3 stages: Unwinding, complimentary base pairing, and joining.

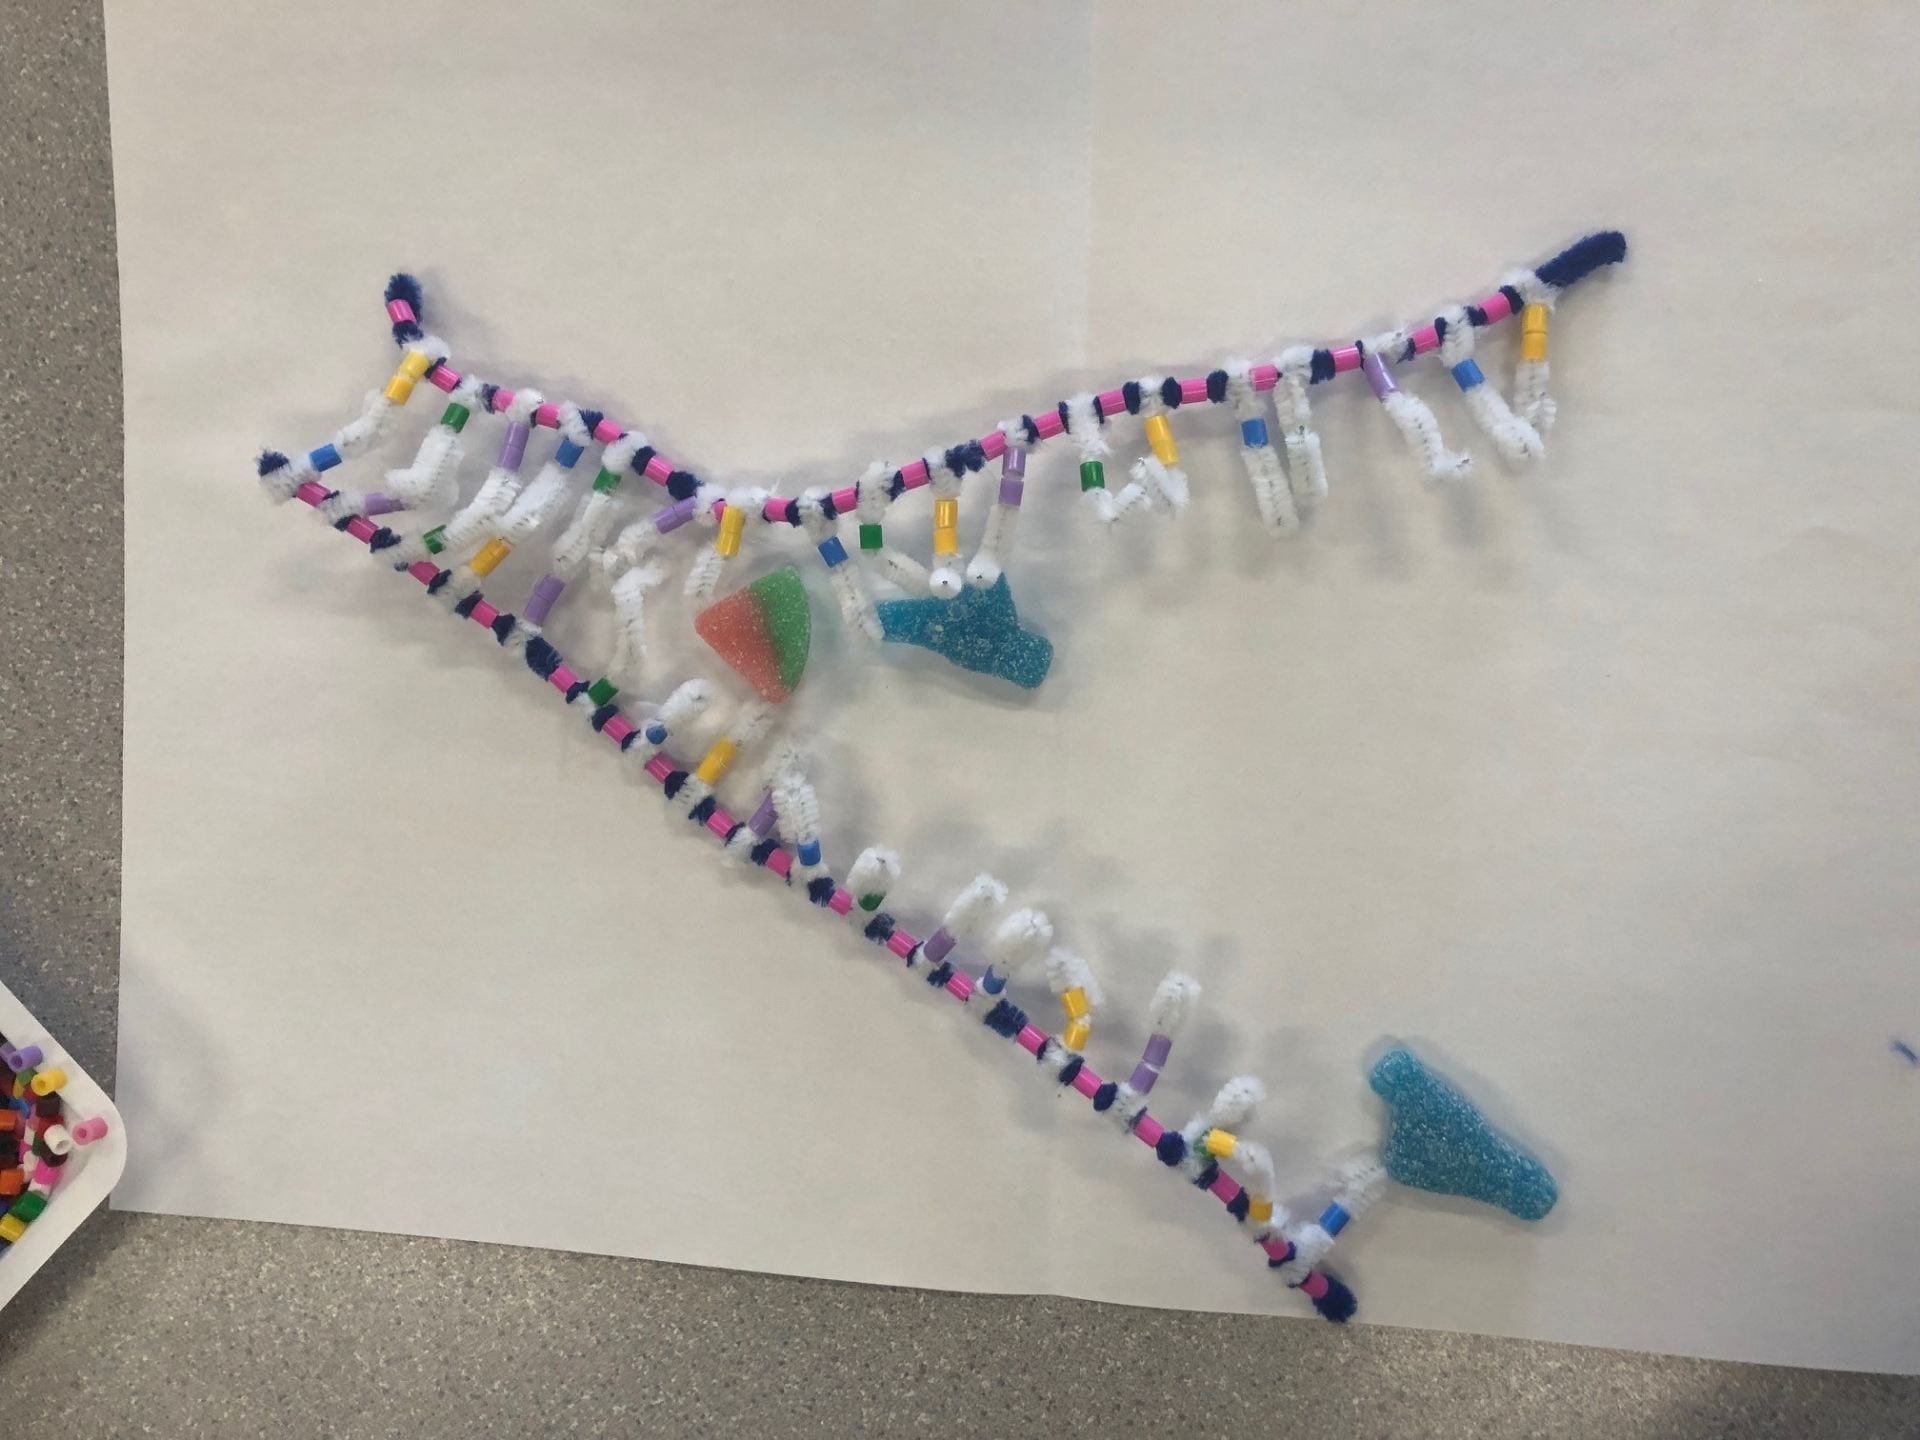
DNA helicase ‘unzips’ molecule

Step 1: Unwinding – The DNA’s double helix structure begins to unwind, the enzyme known as helicase “breaks” the hydrogen bonds that are holding the complimentary base pairs together. The separation of two single strands of DNA creates a shape referred to as the replication fork.

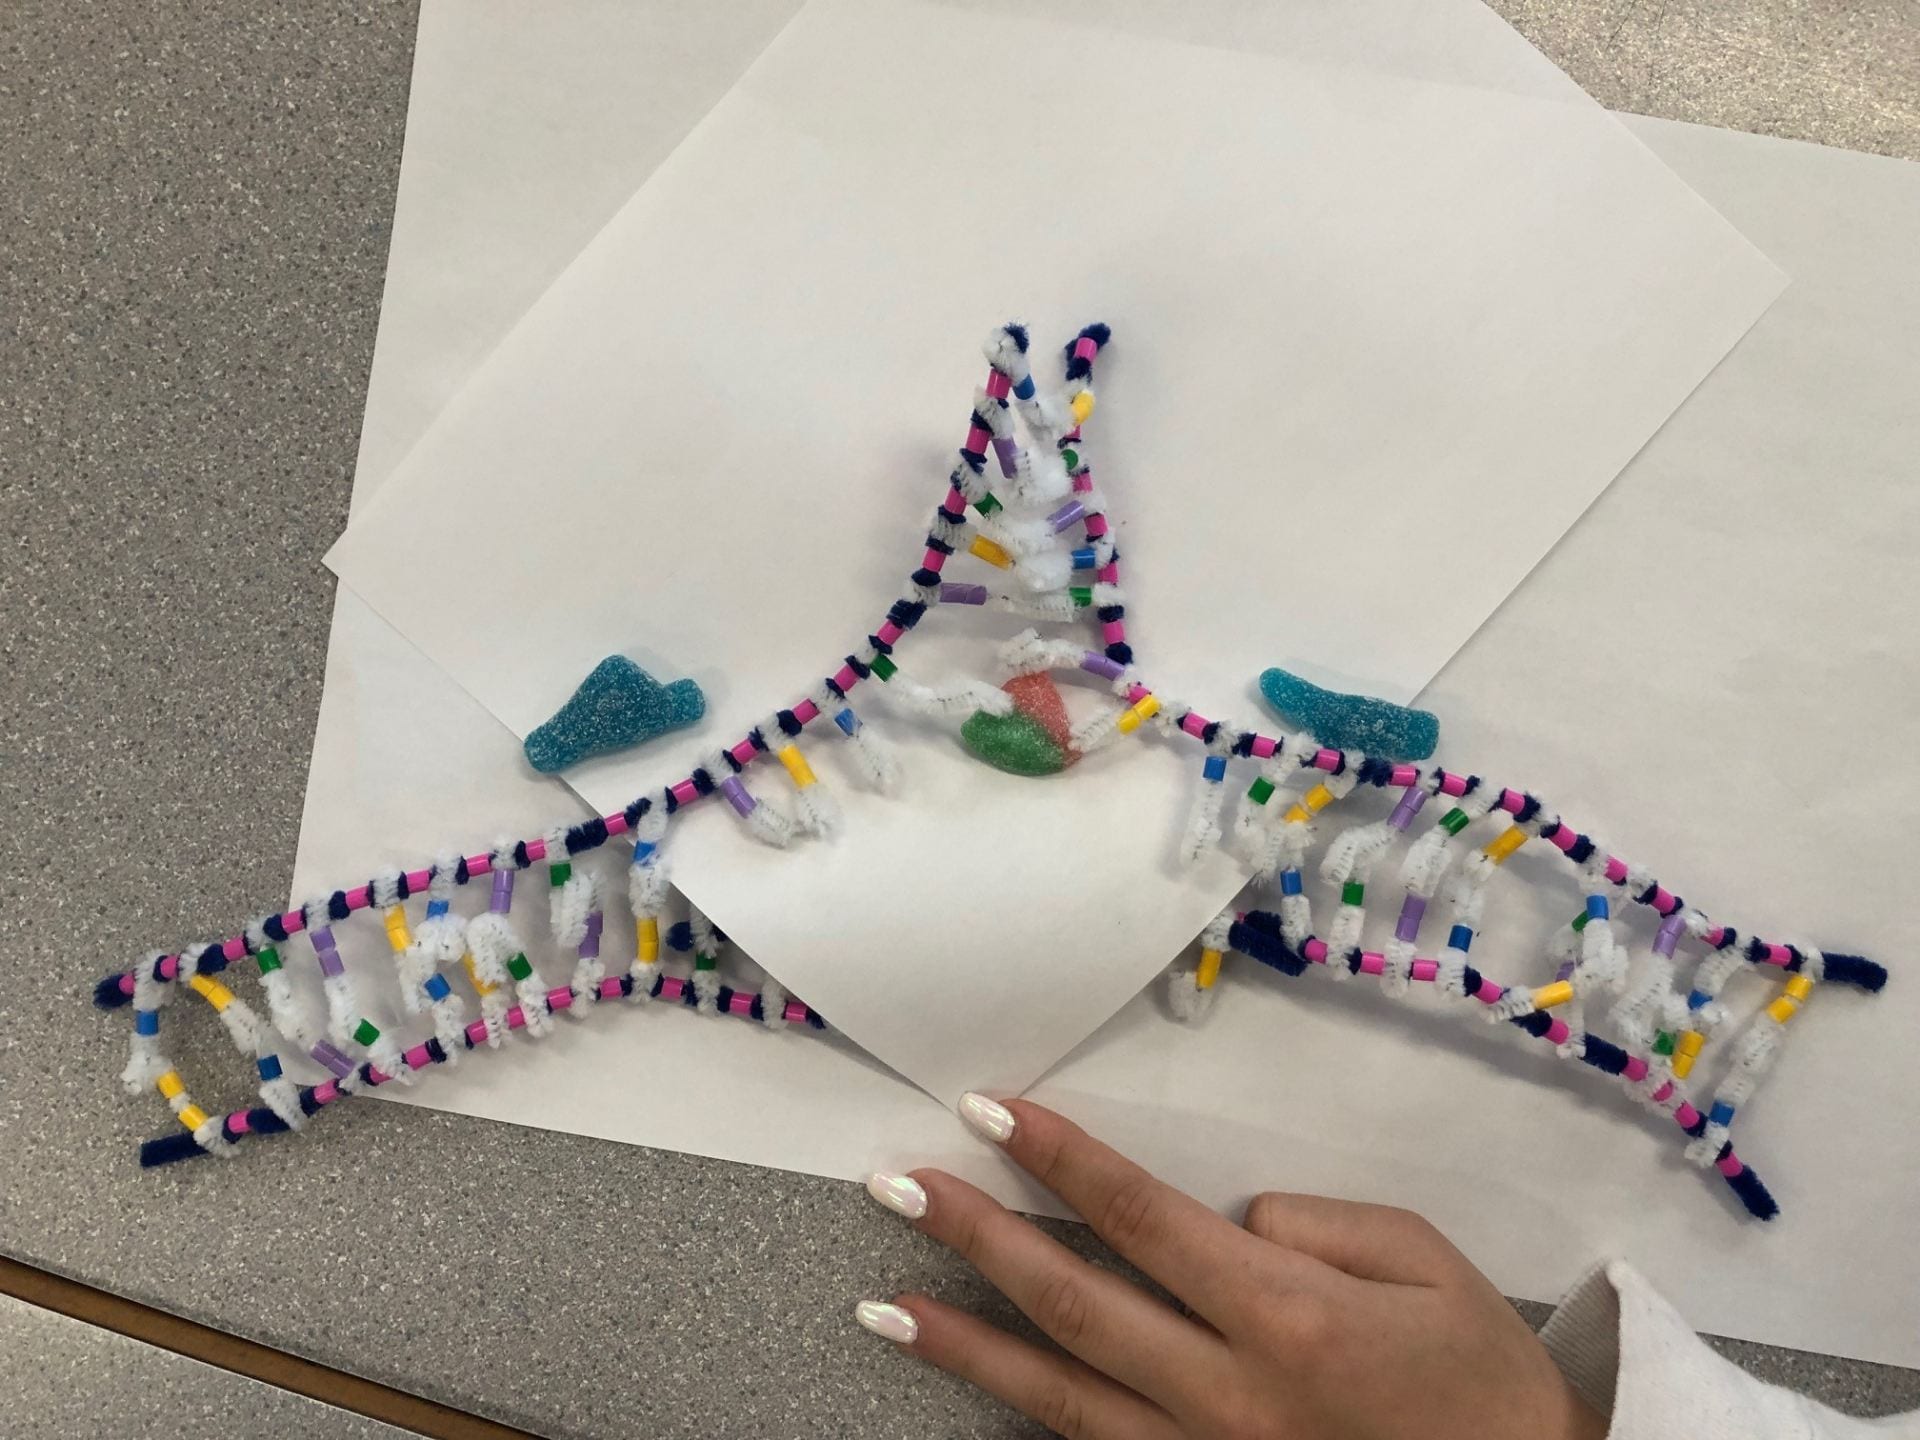
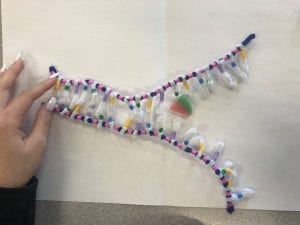
DNA polymerase begins working on the strands

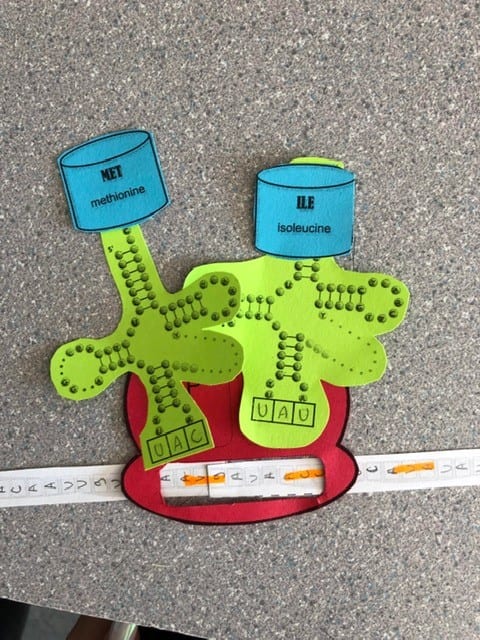
Step 2: Complimentary base pairing – Nucleotides present in the nucleus move and form a H-bond with “partners” on the template strands of DNA. This process is facilitated by DNA polymerase.  One strand is in the 3′ to 5′ direction (towards the replication fork), this is the leading strand. The other strand is in the 5′ to 3′ direction (away from the replication fork), this is the lagging strand. Replication that occurs on the leading strand is continuous. A primer binds to the end of the leading strand and acts as a starting point for DNA synthesis. DNA polymerase binds to the leading strand and ‘walks’ along it, adding new complimentary bases to the strand in a 5′ to 3′ direction. Replication that occurs on the lagging strand is discontinuous. A number of RNA primers bind to the lagging strand at various points. Parts of DNA (Okazaki fragments), are then added to the lagging strand in the 5′ to 3′ direction. The reason the lagging strands replication is discontinuous is due to the fact that the Okazaki fragments need to join up later.
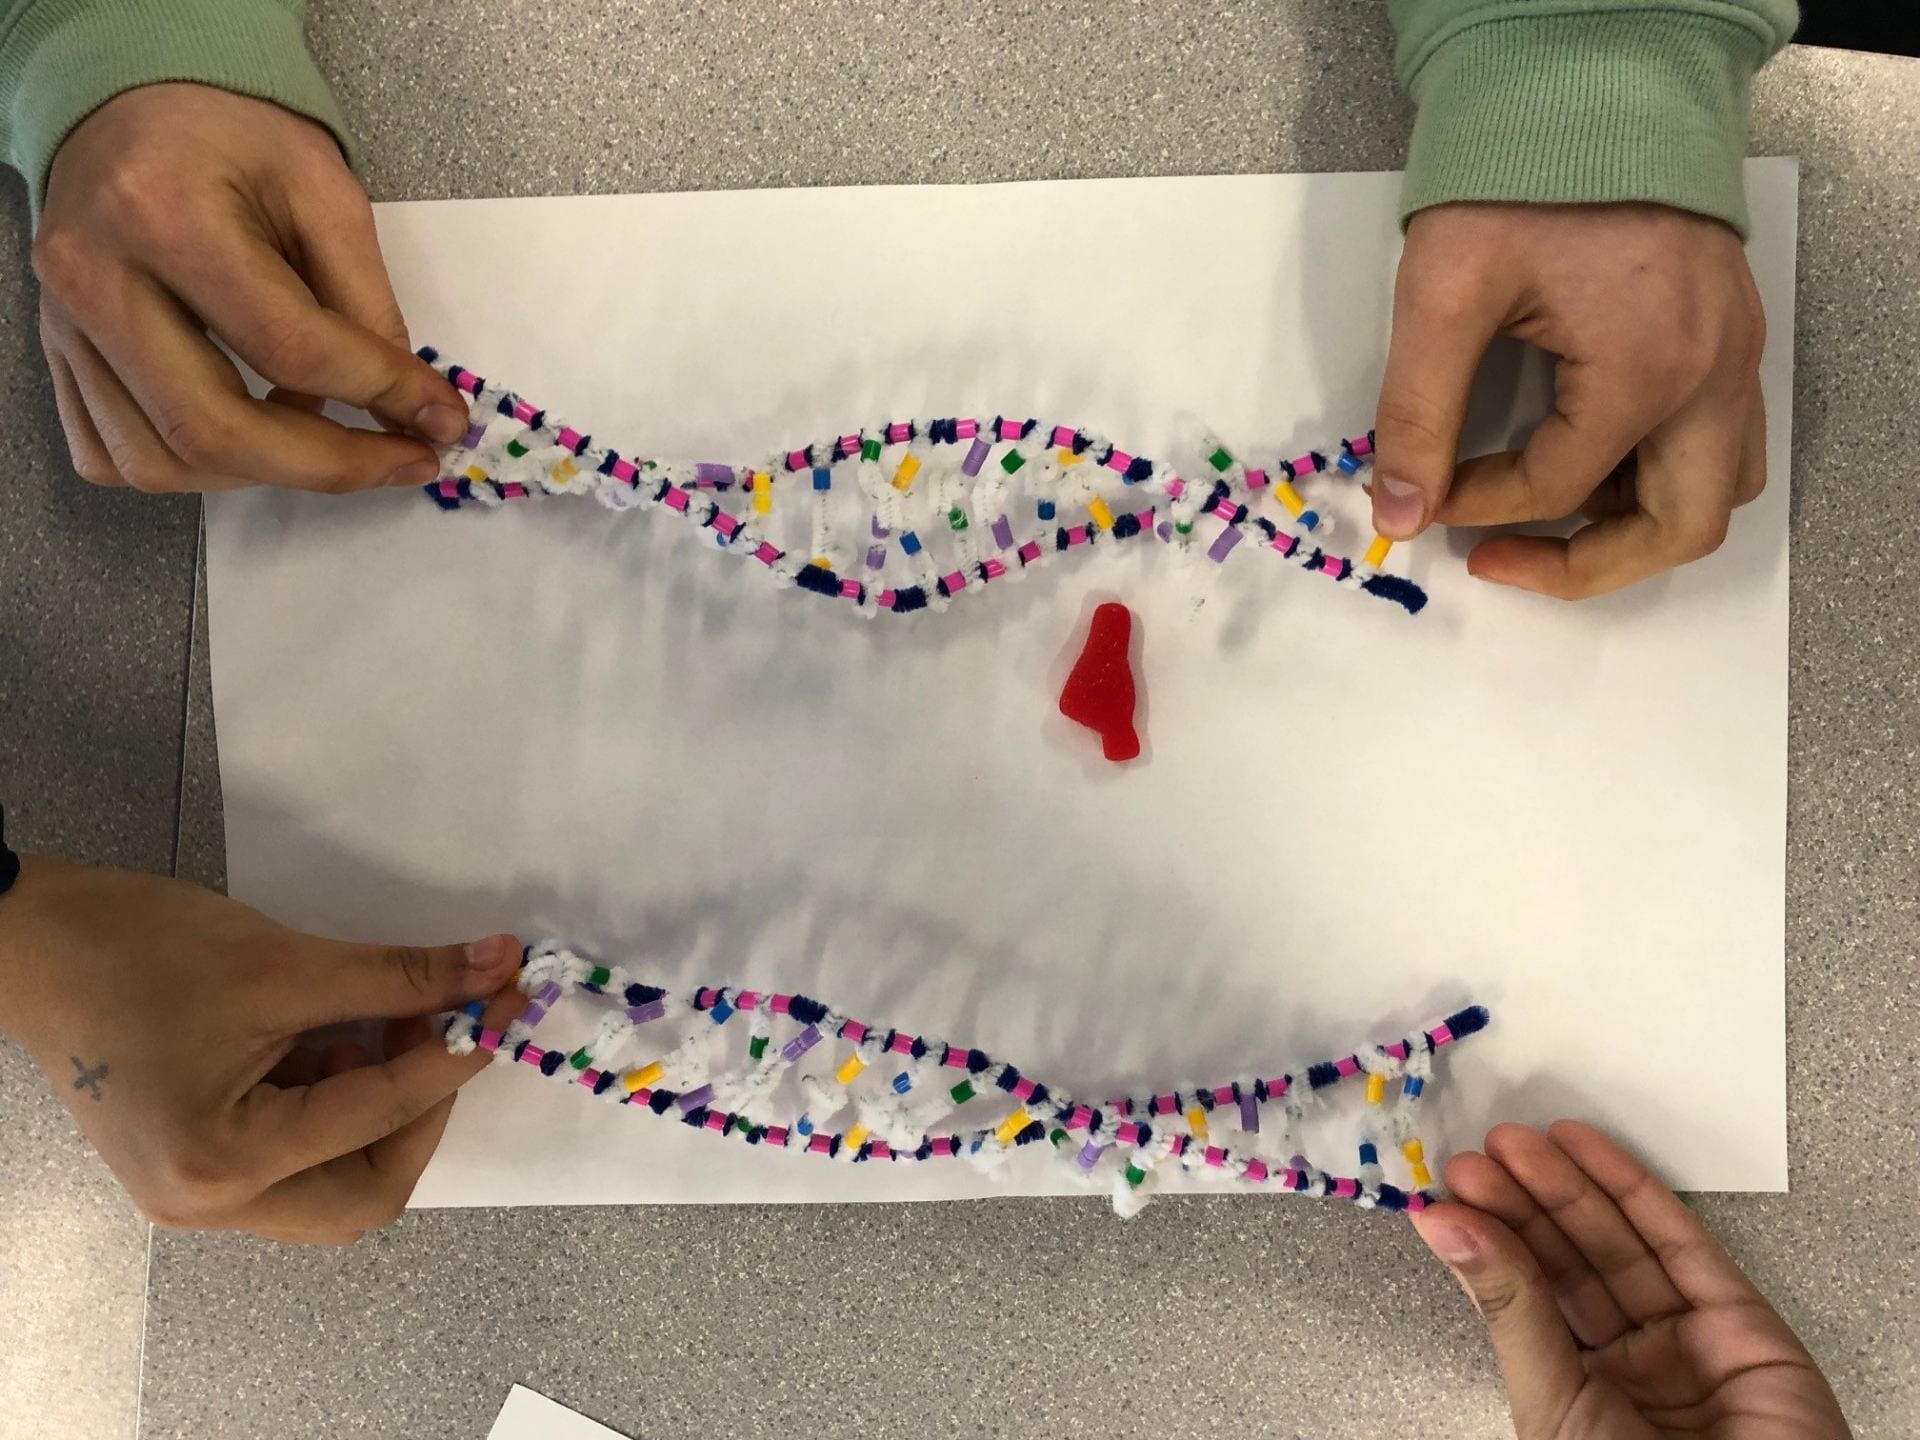
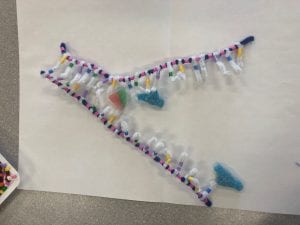
Daughter Strands

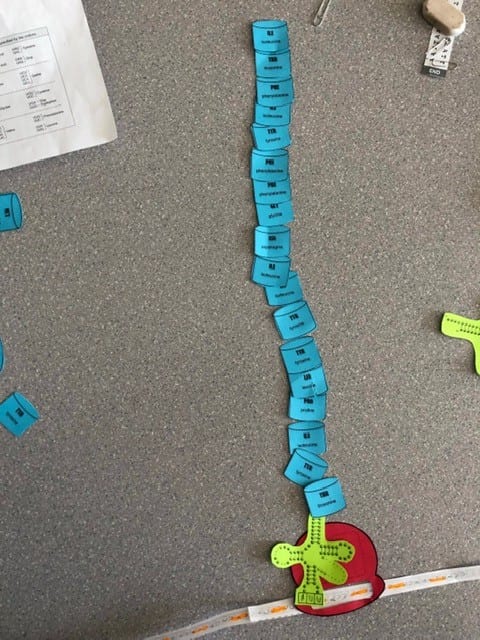
Step 3: Joining – Covalent bonds form between nucleotides on the new strand. The leading strand will remain continuous as the DNA “unzips”. On the lagging strand, fragments will begin to form as the DNA “unzips”; the fragments will be glued together by DNA ligase. As a result two daughter strands are formed.


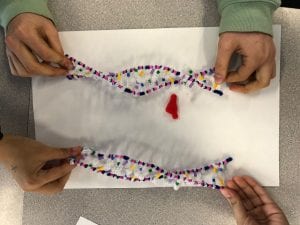
5. The model today wasn’t a great fit for the process we were exploring. What did you do to model the complementary base pairing and joining of adjacent nucleotides steps of DNA replication. In what ways was this activity well suited to showing this process? In what ways was it inaccurate?

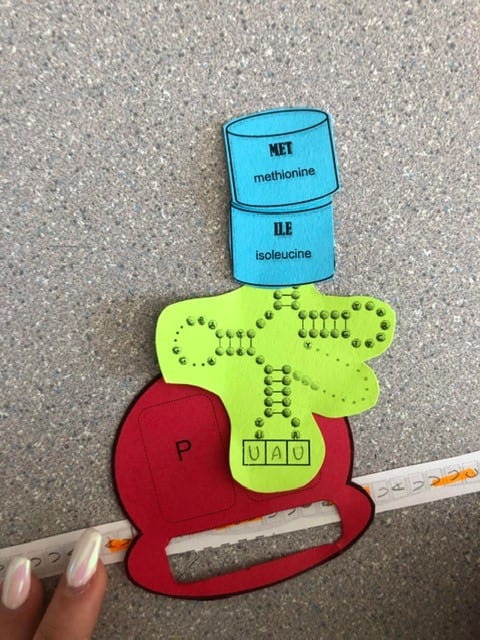
To model complimentary base pairing we paired some of the ‘free’ nucleotides to the complimentary base on the template strand. To show the joining of adjacent nucleotides we attached the newly based pairs to one of the backbones.

This activity gave a good visual on how the leading and lagging strands are read. It also demonstrated how the bases were attached to the leading strand. Some of the things that made this activity inaccurate was the use of the candies. We only placed the candies in the areas where we thought they would be placed and function, we didn’t get to see how they interact and work. We also knew where to place DNA polymerase yet, it didn’t really help show its function and how it interacts with the lagging strand. It was easy to understand how the DNA polymerase interacted with the leading strand but was harder to grasp and show for the lagging strand.


Desmos Art Functions Card 2018

https://www.desmos.com/calculator/scrkfc0qh7 

The first thing I did to start off this project was to come up with a rough plan of what I was going to do. I first started out my playing around with DESMOS a bit and playing with some basic functions to see what kind of things I could do to them to get different shapes. From the start I already had an idea of how I was going to use square roots, semi-circles, and quadratic functions for the different parts of my portrait. I also decided to take a look through the text book in order to get any ideas for how I could incorporate certain functions into my card. This helped me quite a bit as I was having a hard time figuring out where to use exponential, logarithmic, and rational functions into my card, as well as to help me properly draw my bun and get the right shape. After completing my portrait I made a rough sketch on paper for the layout of the rest of the card in order to figure out the spacing. As a final touch I decided to add smaller details such as earrings and a hair tie in order to incorporate some more functions into the picture as well as to help bring the portrait more to life, and display more of my uniqueness.

While I worked through this assignment I ran into quite a few challenges. Most of which I had to just play around with in the end since most of the people I had asked for help also didn’t know how to solve my problems. Some of my problems that I had were trying to shade in my bun which I did end up getting help with, as well as how to transform certain functions or make it so that the shading doesn’t overlap. I ran into quite a few minor problems but managed to work through almost all of them myself mainly through just playing around with the numbers/ restrictions in the function. Some of the aha moments that I had consisted of learning how to manipulate certain functions such as rational functions, which it seems I had totally forgotten how to do until it all came back to me while doing this assignment. The other aha moment I had was when I was trying to figure out how to properly shade and use function notation. When I had finally got the hang of both the notation and the shading I found  the assignment to be satisfying when I would successfully shade a section or put a whole folder in function notation.

My main strategy or plan of attack for this project was that I made sure that I focused on the portrait before anything else and that when doing so I focused on one aspect of my portrait at a time. I did so as a way to stay organized and not get confused at what I was doing. I also made a list of the six functions that were part of the criteria and made a checklist in order to make sure that I got all of them. I found that the folders and function notation did really lessen the workload and made it easier for me to stay organized and keep everything in its place.

Overall I think this project was a good way to really show what you know about functions, and show your understanding of them. By doing this project I got a good reminder of some rules that I may have forgotten from the first part of the semester which I think is good for future reference; it was a good refresher for me. It also surprised me since I thought that this assignment was going to a bit more difficult than it was in the end since I didn’t think i knew that much about functions as I did. It forced me to dig deep down in my brain and really apply my knowledge.

Neuron Communication

A Neuron is a specialized type of cell that sends out nerve impulses.

Neuron structure 

https://www.khanacademy.org

  • Dendrites – Get their information from different neurons and sensory receptors
  • Cell Body – The life support center of the cell
  • Axon – Transports the neurons messages to different parts of the body
  • Myelin Sheath – Surrounds the axon of some neurons to cover them, and helps increase the speed of neutral impulses
  • Terminal Buttons – Creates junctions with the other cells

Neurons can be separated into three different groups: 

  1. motor neurons
  2. sensory neurons
  3. interneurons

Neuron function 

There are four steps on how an action potential moves along the neuron fibre: Resting Potential, Depolarization, Repolarization, Refractory Period.

  1. Resting Potential: This is the first step in action potential. The neuron has Positively charged potassium ions on the outside and more negatively charged ions on the inside then positive.
  2. Depolarization: The next step is called depolarization (sodium ions flow in).  When a small section of the axon neighbouring the cell body is stimulated. In the stimulated spot pores in the membrane open up and allow positive ions to move inside the membrane of the cell making the inside more positive.
  3. Repolarization: The third step is called repolarization. Certain sections in the membrane open up and allow sodium ions out of the axon, causing the inside of the axon to return to its original charge. This causes depolarization to occur in the next section of the axon.
  4. Refractory Period: The last step in action potential is called the refractory period. When the positive and negative ions move back to their original places and the neuron returns to its resting state.

Synapse structure

Provided by the Administrative Education  System

Synapse function

When action potential gets to the end of the neuron, it causes a chemical signal (neurotransmitter) to be sent out to another neuron. The action potential then arrives at the axon terminal which then causes the synaptic vesicles to release NT in the synaptic gap. The NT then diffuses through the synaptic gap and latches onto the receptors on the postsynaptic membrane on the receiving neuron . The NT message can then be taken in one of two ways, excitatory (stimulates the AP on the other neuron) or inhibitory (represses the AP on the other neuron). If the receiving neuron produces its own AP then it will be excitatory, if not then it will be inhibitory. GABA and glutamate are both factors that affect weather the neuron will be excitatory or inhibitory.