This week in precalc 11 we focused on the new unit we just started, graphing inequalities and systems of equations. A lot of the things we learned this week was review from what we did in grade 9.
What we learned was that solutions to linear in two variables is represented by a boundary line and shading on one side. Depending on the inequality used …
Solid line : ≥ ≤
Broken line : > <
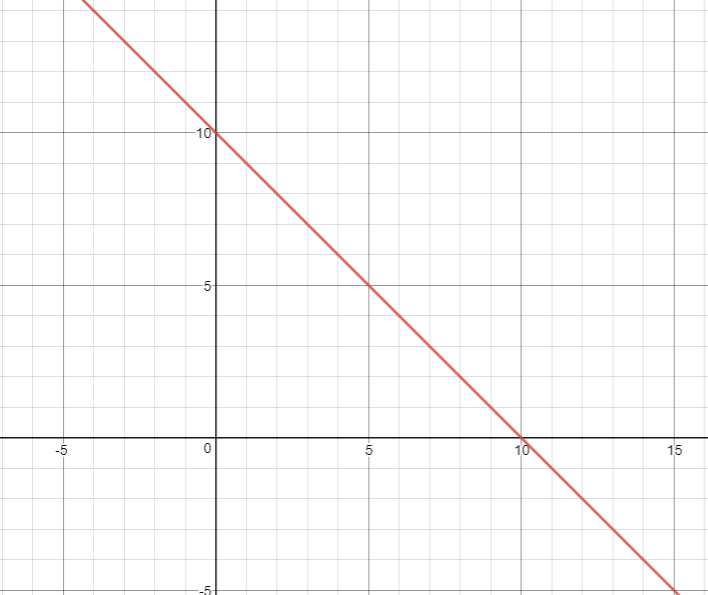
So for example we have an equation :

What we want to do to be able to graph it is to make y by itself :
From what we learned in grade 9 we know that the mx is the slope and the b is the y intercept
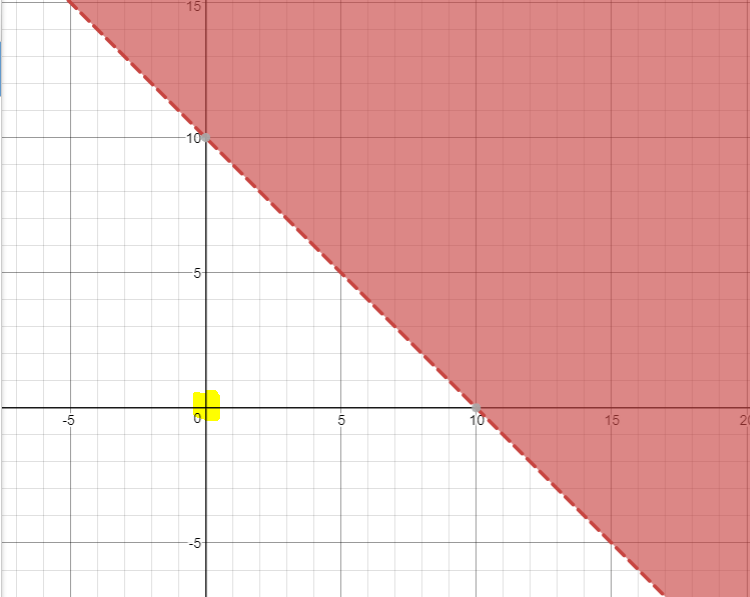
The way we are going to figure out if we shade one side or the other is by using test points. The easiest point to use is (0,0) or (1,1) or (2,2) so you don’t get mixed up by the x and y’s. So since this equation has a >, we know that the line will be broken. Now we can use a test point to figure out what side will be shaded (the shaded side is the side with all the possible solutions)
I will be using (0,0)

 + 10")

So the side where (0,0) falls in will not be shaded since it doesn’t work as a real solution. We must now shade the other side.
What we are now learning is pretty straight forward. It is just important knowing if its a solid line or a broken line, if we shade one side or the other and most importantly knowing how to graph the graph.
Leave a Reply