This is my Desmos graphing project from Pre Calculus 12. We were asked to choose an image and recreate it on Desmos.com, using graphs and function notation.
This is the original photo I used:

This is my final project:

Reflection:
- I figured out which equations to use by starting out with more basic ones, such as parabolas, trig functions, and linear functions. Then as I got more comfortable with the process I incorporated other functions like exponential, radical, and circle relations.
- I had a few challenges at first, the main one being using proper function notation. After realizing how to do this, I had to change some of the functions I had written incorrectly. Thankfully I had not done that many, so it was fairly easy to fix.
- One “aha moment” I had was when I figured out how to create custom colours using an ‘rgb’ code. I found this fun and interesting as I did not realize it was possible with Desmos. I was able to create the exact colours I needed to create my project and be creative with the tone and shade of each one.
- I got help from my teacher when needed, as well as from examples I found online for specific types of functions or relations. For example, I wasn’t sure what the equation would look like for an ellipse, so I went to Desmos.com and it showed me an example. This helped me in creating my own functions and then transforming them to fit with the lines for my project.
- The main strategy I used to complete this project was proper time management. I made a goal to work on this project over time instead of at the last minute. I added a little bit to the image each day. I often procrastinate with homework, so I wanted to make sure I was focused on this as I know it is a time consuming project. Managing my time and doing small amounts over a few weeks helped me finish it on time, and prevented me from being stressed right before the due date.
- This assignment helped me understand the transformation of functions and relations by allowing me to see the visual graph of every function I created. It also gave me a new perspective as to what you can do with math. I think it is interesting how you can create a visual art piece using only numbers and graphs. Overall, I enjoyed working on this project and I learned a lot!
Self-Assesment:
This is a reflection I wrote about practicing my Creative and Critical Thinking skills in precalc 11:
Below is a self reflection on an assignment I completed in CLE 10 this year.
Here is a Core Competency reflection I wrote, based on my mood board project in Textiles 11.
This is a self-reflection on my final project in Textiles 11:
This is a self reflection I did about the contextual infographic project from my English 10 Honours class.
Here is a link to the infographic project on my blog:
Contextual Infographic Project | Annabelle’s Blog (sd43.bc.ca)
This is a project I did in my Math 10 class, to practice graphing and linear relations. I used Desmos.com to create different equations that made lines on a graph. Each line made part of a letter, to spell my name.

Write-Up:
Creating my name out of linear equations was an interesting way for me to practice my math skills and be creative at the same time. I really enjoyed this project because I could be artistic, which usually isn’t connected to math. To create the equations for the slanted lines, I used point-slope form, which is y-y1=m(x-x1). I also used the equations x= and y= to make horizontal and vertical lines. To change the height and length of the letters I wrote the domain or range of each equation. This allowed me to choose a specific point where each line could start and end. I decided to use all capital letters for my last name because they are a bit more simple to create. But for my first name I did the letters lowercase, so that they would look more unique. These letters were more difficult to create out of equations because there were a lot more lines for each one.
The main challenge I had was making the slanted lines for the letters like A, B, and N. I figured out that using point-slope form would be a good way to do this, because all I needed was the slope and one point. I chose the starting or ending point of the line and found the coordinates, then made them into an equation with the slope. Although I got stuck a few times, I kept trying out new combinations of numbers until I found something that worked. After a while this got easier for me and I was able to do it without help. The other challenge I had was lining up my last name under my first name, so they would take up the same amount of space and look centered. My first name has 9 letters and my last name has only 8, so I had to make the last name slightly larger. I calculated the distance my first name took up, and then divided it by 8 so I would know how big each letter should be. I started to create the equations for my last name, but I realized that it wasn’t working out and the letters weren’t lined up like I planned. I thought I had calculated everything correctly, but since it wasn’t working I decided to ask my Dad for help. He figured out that I hadn’t added on the space between each letter, so they were bigger than they were supposed to be. This was like an “aha” moment for me. Once I figured this out I just changed the domain and range of the letters to move them over.
After I had made all the letters, I decided to make it more artistic by changing the thickness and transparency of the lines. This made each letter look like slightly a different colour with an ombre affect. I learned a lot about relations and graphs from the assignment because I was creating each equation from scratch, rather than solving them in my textbook. Since my name is pretty long, I got a lot of practice writing equations that were different for every letter. I realized that every single line on a graph has a different equation. Overall, this assignment was a really enjoyable way to practice writing equations and see how they look on a graph.
Core Competency Reflection:
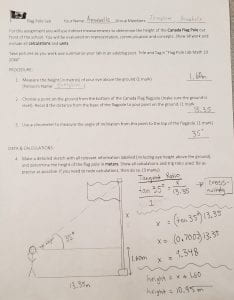
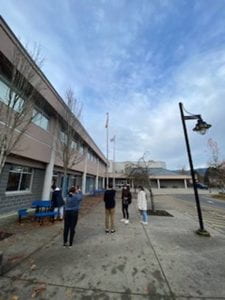
This is a group lab that I did in my Math 10 class to practice trigonometry skills. The goal was to find the height of a flagpole at our school, by measuring the distance on the ground to the flagpole as well as the angle of elevation. We used a trundle wheel to measure the distance, a clinometer to measure the angle, and a meterstick to measure the height of our eyes.
My group found that the flagpole was 10.95 metres tall. This activity taught me that trigonometry is really useful, and an easy way to measure the height of very tall objects, once you learn how to properly measure and make calculations. I really enjoyed this lab because it was a real-life example, and a great way to practice trigonometry.


Here are some pictures of what we did:


Core Competency Reflection:
This is a self-reflection I wrote, about a movie pitch I made in Socials 10:


