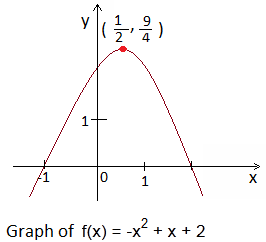
1. Definition: A quadratic function is the degree of 2. Can be written in this form ( y = a + bx + c)
graph of every quadratic function is called a parabola.
2. examples
3. desmos
a) see what happens:
graph forms a dip like thing on the graph. when you move the slider it changes in width, length and height.
b) Start with slider values a=1,b=0,c=0. Describe any symmetry you notice:
This turned the graph to be exactly center on the 0 line on the graph. Everything looked organized and perfectly lined up.
4. Compare two functions:
x² + 7x + 12 = 0
find two numbers which come to 7 and multiply to be 12. You immediately come up with (3, 4). which would be both your x values.
5. Describe what happens to the graph when:
a) a<0
Does the graph have a maximum point or a minimum point?
- no?
b) a>0
Does the graph have a maximum point or minimum point?
– no?
c) -1


