Relation or Function
This week in math 10 we learned how to tell whether or not we are dealing with a function or a relation just by looking at a graph, mapping diagram or a table chart.
Graph: If there are closed dots that are found vertically in the same line or there are 2 horizontal lines that that are situated one directly on top of the other that both are not considered functions, because they share the same x value and a different y value.
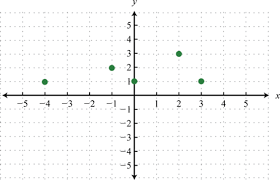
Function: Because both the x values and y values are different. And there are no closed dots that are found in the same vertical line.

Relation: Because there are lines that are horizontal that pass one on top or the other. Which means that they share a vertical line.
Mapping: An easy way to tell if a mapping diagram is a function is if the lines are connected to one other number and if all the x values are different. You always want to look at you x values first and if all you x values are different it’s okay for them to share the same y value. If there are 2 or more of the same x value the only way for it to remain a function is if they all have the same y value.

Function: Because, all the x values are different and they are all connected to a different why value.
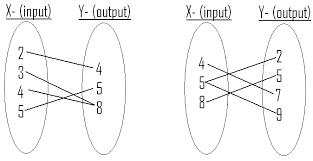
Right diagram: Function, because even though 3 and 4 share 8 as their y values it’s okay because they are different x values.
Left diagram: Relation, because 5 (the input number) has 2 different y values 2 and 9.
Table chart: An easy way to tell if a table chart is a function is if the x values and y values are different. It’s the same thing as the mapping diagram, you always want to look at you x values first and if all you x values are different it’s okay for them to share the same y value. If there are 2 or more of the same x value the only way for it to remain a function is if they all have the same y value.

Function: Because all the x values and y values are different.
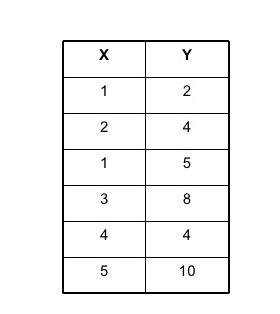
Relation: Because if you look at the x values there are two 1s and both those 1s have different y values. (1,2) (1,5)