In math class, we were asked to graph Santa on desmos. This is the Santa that I created using different linear relations and functions, by restricting the domain and range I was able to place the shapes in a layout to create a Santa!
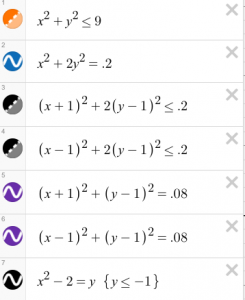
 These are the expressions used to create the face:
•The first one x squared plus y squared is a linear relation, not a function used to create the circle. In order to add color, I changed the equal sign to make it an inequality. I chose 9 as the inequality for the size of the face.
•The nose, I left at the origin and just created an oval making the coefficient y not equal to the x coefficient and left it not filled in.
•For both the eys I made a small circle and a larger oval to make them a little more realistic. I changed the quadrant of the circle by adding x-1 to the right side and x+1 to the left quadrant to make the eyes on different sides. I made sure they were the exact same numbers to make sure they were symmetrical and proportionally equal.
•For the smile, I used a quadratic function to create a parabola and chose the origin of -2 by adding it as the constant of the equation. For the range, I stopped it at -1 to restrict the smile so that it’s not too high up on the face.
 Now, for the add – on’s to the face.
•For the hat, I used an upside-down parabola where x squared equals negative y instead of positive. The constant negative 8 was chosen for the height of the hat. I made the range 2 so that it came up just to the forehead of the shape of the face.
•Then for the line to close up the shape of the hat I just went y=2 so that a horizontal line appeared on the y2 axis. Making sure to add restrictions at -2.5 and 2.5 on either side of the face.
•For the pom-pom at the top of the hat, I created a ball right down the middle of the x-axis and on 9 of the y-axis so it rests just above the hat.
•Finally, for the beard, I made a parabola with the origin of -8 so that it went lower. I made sure to restrict it to a range of -1 so it stops at a good point on the sides of the face.
After doing this activity I feel much more confident with functions and relations and now know mentally what a function would look like if I were to graph it.
