This week in PreCalc, we started our new unit on Graphing Inequalities and Systems of Equations, so far, I actually really like the unit, it reminds me a lot of what we did last year, it’s very similar but we expanded, of course, but even then, I like how when you figure out the equation, you can graph it and solve your answers.
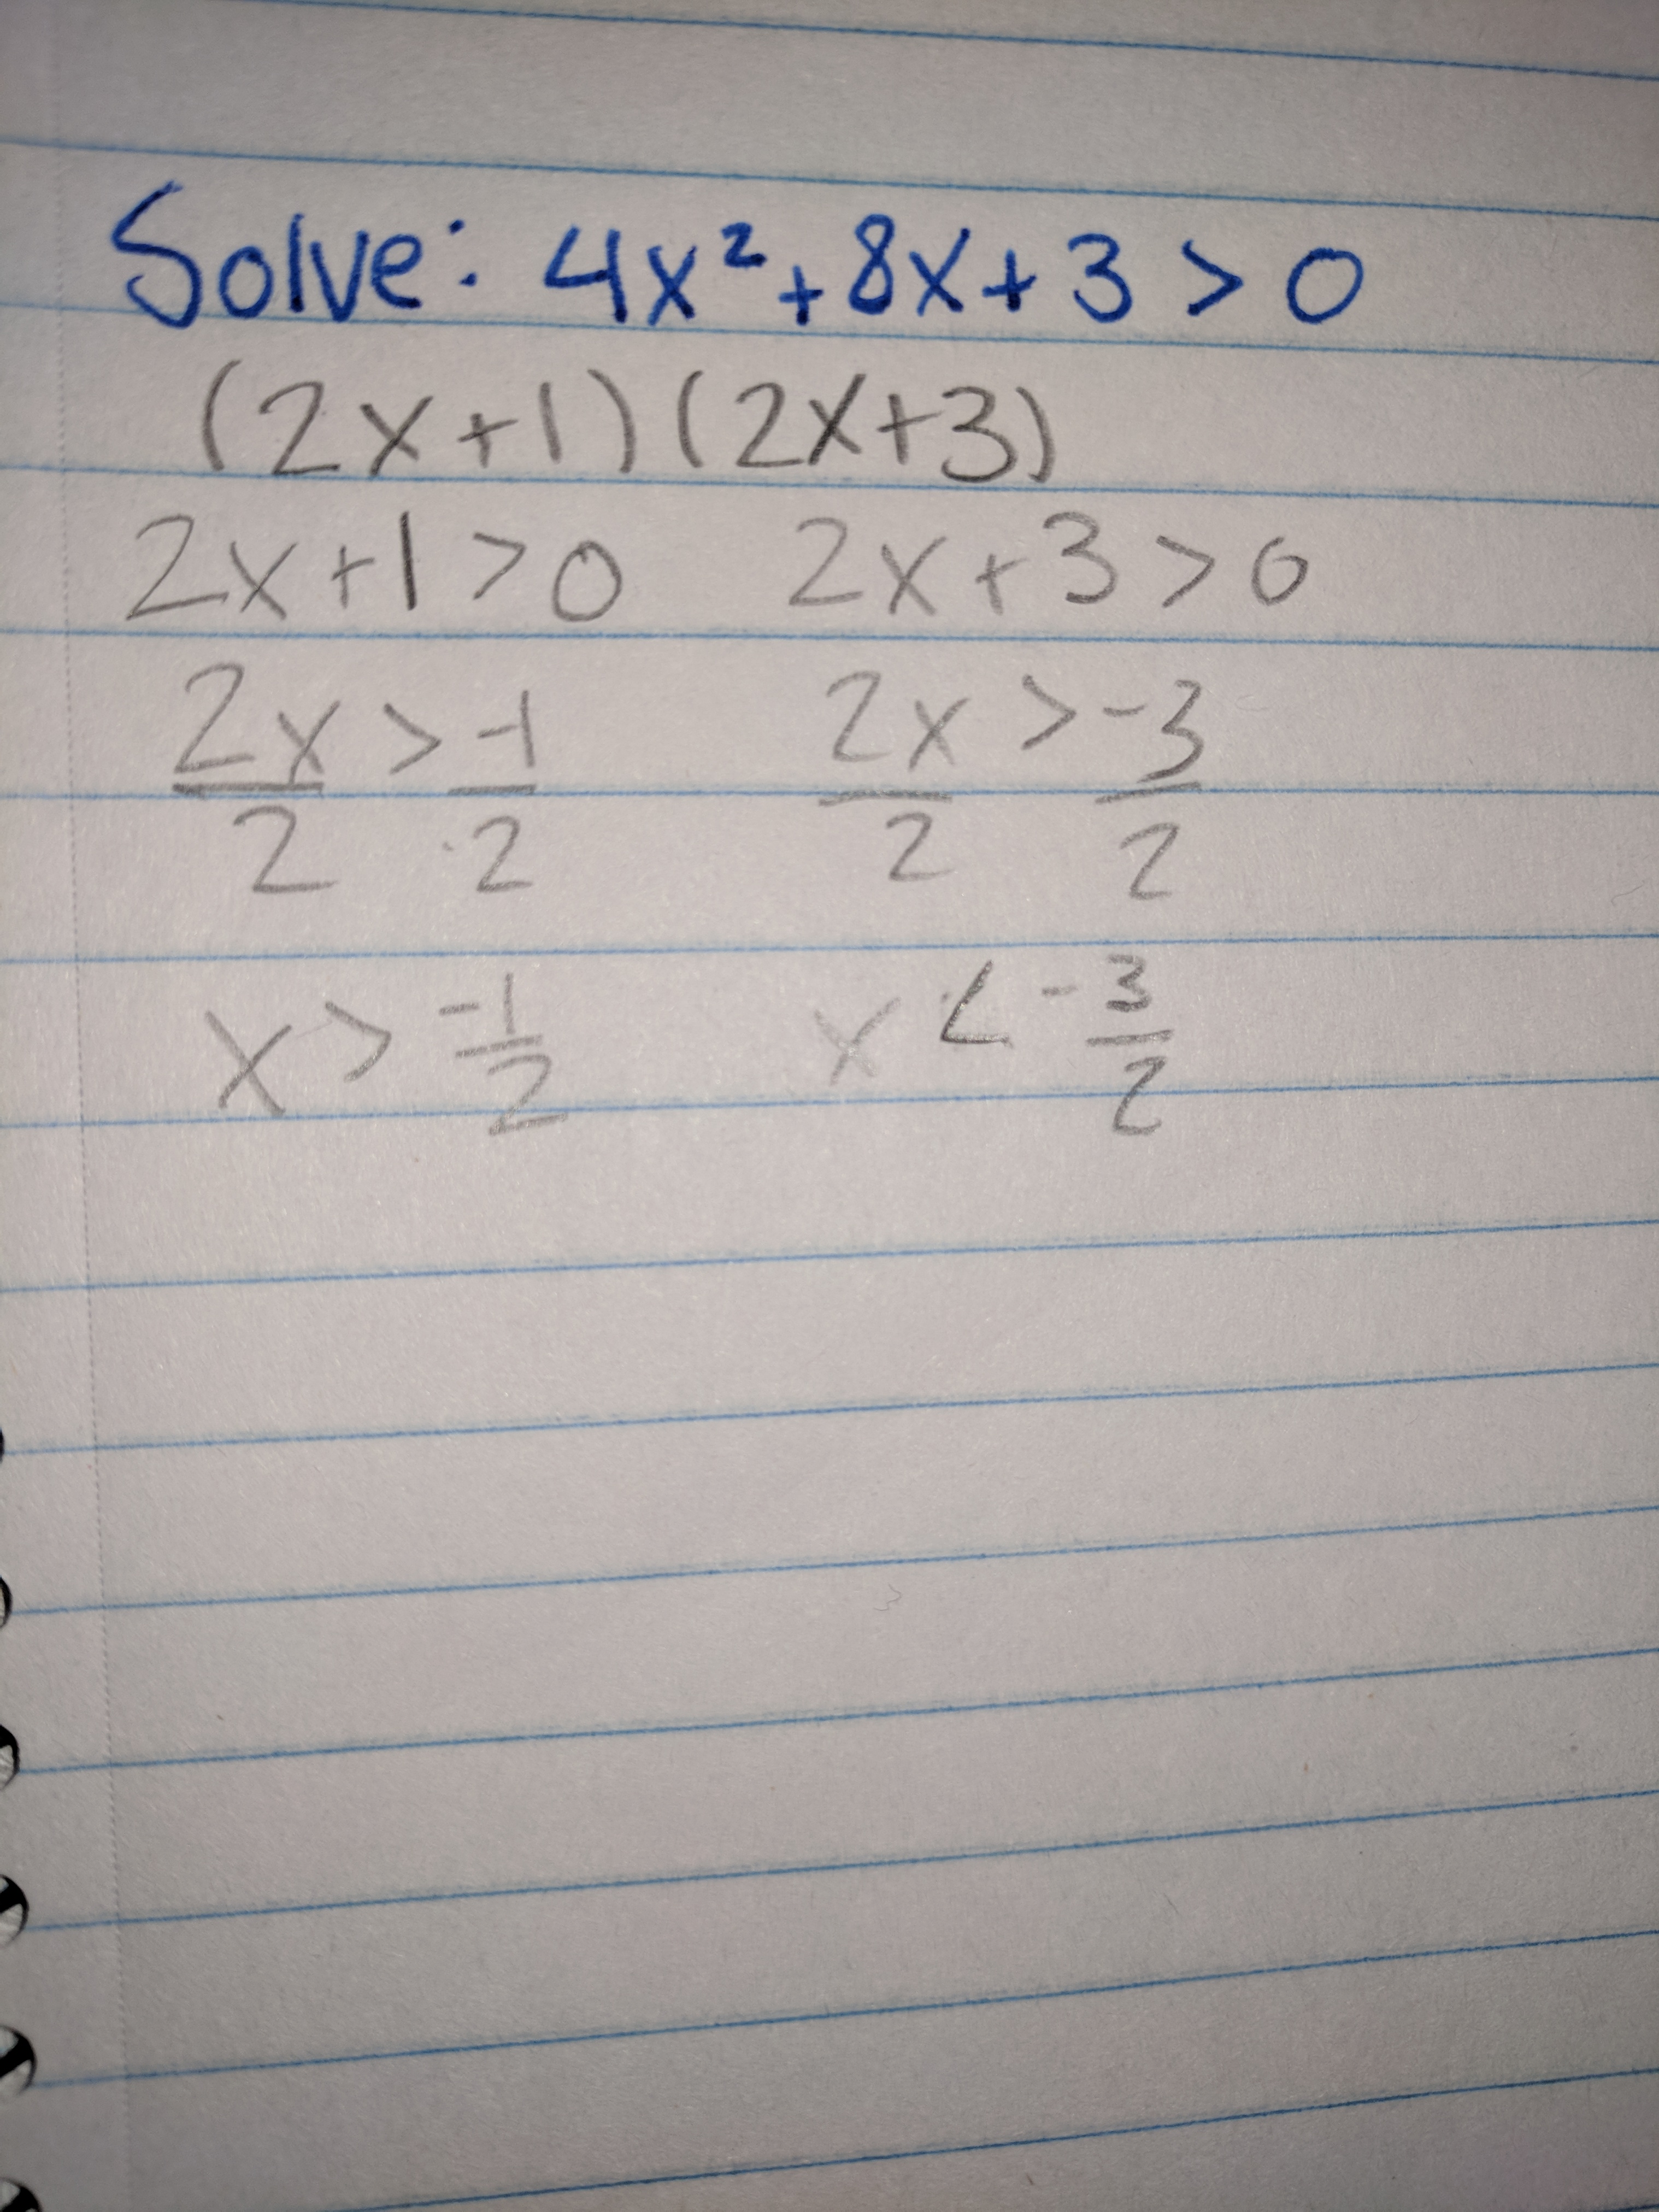
We’ve done 3 lessons and we learned how to work with one and two variables. When you only work with one variable, you can only use the x-axis but when you are dealing two variables, you can actually graph it. My favourite thing we’ve done this unit (so far) is determining whether or not each point is a solution of the given inequality… you just have to plug in the points on the graph that it gives you and you have to put the x value where it asks for x and the y value where it asks for y (1st example below). I also enjoyed solving inequalities, that’s where you take the equation in general form and you factor it (if you can) which gives you the x-intercepts, (example, also below)