This week in math we learned how to multiply polynomials using diagrams.
There are 2 different kinds of diagrams that we learned. One has algebra tiles and the other one is area diagrams, they are both displayed in a table.
Diagram 1 (algebra tiles)
This is an example of a question that you might be given.
You want to start with a table that looks something like this. once you have your table drawn out you need to separate and organize the equation accordingly.
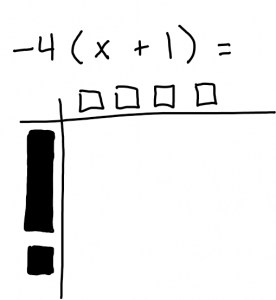
(shaded tiles = positive) (unshaded tiles = negative)
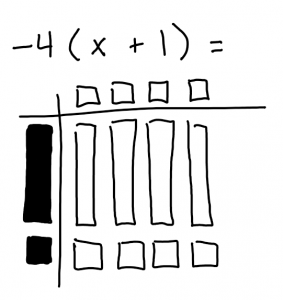
This is the step where you draw out the multiplication. You want to draw the squares and rectangles making sure you line them up properly with the crossing shape.
Keep in mind…
negative x negative = positive
positive x positive = positive
negative x positive = negative
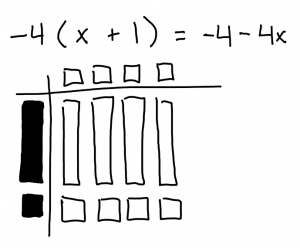
When you write out the final equation you want to make sure you have the proper algebra tiles (  ,
,  , #)
, #)
Diagram 2 (area diagram)
This diagram is very similar to the first example but instead of algebra tiles you use the numbers, variables and exponents.
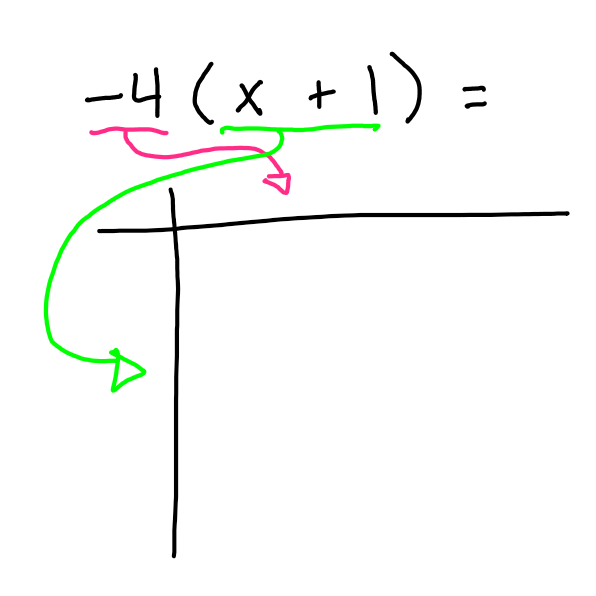
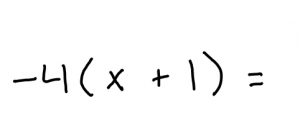
again you start out with an equation that might look something like this.
. 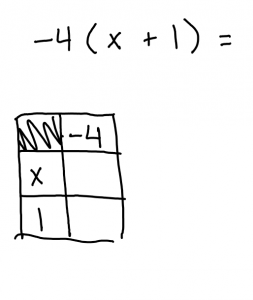
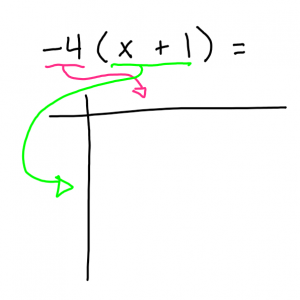
When you put the expressions into the table you want to directly use the numbers and variables.
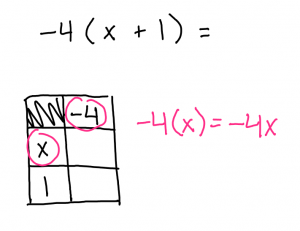
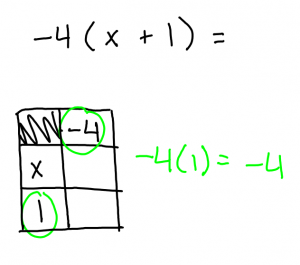
in this step you want to multiply the crossing variables.

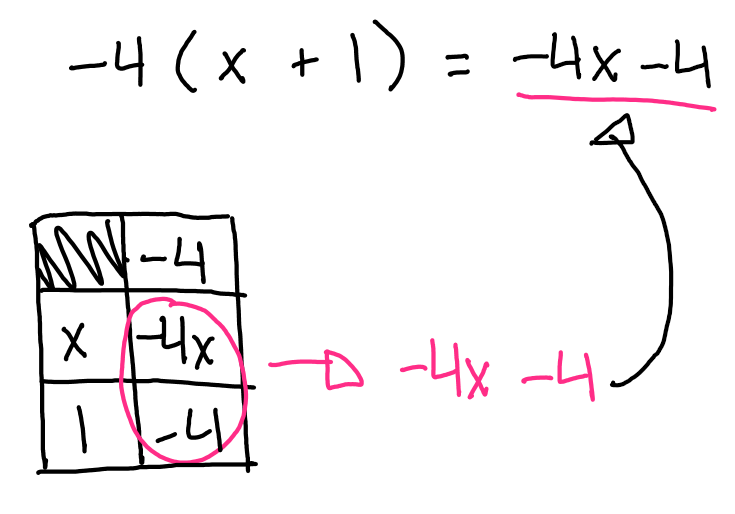
Once you know the values for the inside of the chart you need to take the variables and write them out.
I didn’t have a hard time learning how to do the diagrams, but this was new information to me. If I had to say one thing that might have confused me or made me think hard while using the diagram, the step where you have to determine if the algebra tiles on the inside of the table are positive or negative in the first diagram make me think hard. After a few example/ practice questions I get use to it and it becomes really easy.
If I were to choose which diagram i like using the most I would say diagram 1 (algebra tiles). maybe because I have more practice with them or a greater understanding of how they work but over all they are easier for me to work with.
something about diagram 2 that I really like is that it is a really direct way to figure out the equation, it is quick and easy and really convenient in some situations.