
Hailey, Rafael
Statistics
Influences on the collection of data
There are many factors that may affect the collection of data those include; bias, use of language, ethics, cost, time and timing, privacy, cultural sensitivity, etc. each of these when used can influence which opinion or side a person may choose. For example in use of bias and use of language you can write a question that favors a side for example asking a question like: “You do like pizza, right?” or asking people in an Apple Store what their favourite phone brand is. You can also tilt the answer by asking at different times of the day, normally people in the morning are more moody than those in the afternoon.
Differences between a population and sample
Population means all people in the area or group are surveyed. This method results in a fair answer.
Sample means only a select amount of people are surveyed. This could through the results of the survey a lot more the population method.
Types of sampling methods
Random sampling: Refers to a set of population in which each member of the set has an equal probability of being chosen. A random sample is meant to be an unbiased representation of a group.
Stratified sampling: Refers to a divided population split into separate groups, called strata. Then, a random sample is drawn from each group.
Cluster sampling: refers to a the total population divided into groups and a simple random sample of the groups is chosen.
Multistage sampling: Similar to cluster sampling, multistage sampling refers to sampling that involves dividing the population into clusters. Then, one or more clusters are chosen at random and everyone within the chosen cluster is sampled.
Systematic random: Refers to a method in which sample members from a larger population are selected according to a random starting point and a fixed, time point.
Differences between theoretical and experimental probability
The difference between theoretical and experimental probability, is that in theoretical probability it is the number of ways that the event could occur. Whereas in experimental probability it is the number of ways that the event has occurred.
Examples of misleading statistics

The issue with the first graph is that the starting number at the bottom of the graph does not start a 0 so the graph has a different look. Although they both have the same information the second picture is graphed better because the starting point starts at 0.

In these pictures the first graph is done better because the starting point is at 0 and there is a larger variety of numbers along the Y Axis, whereas the second picture starts at 5 and there is not a lot of numbers along the side. This results in a different appearance that makes the graph look like it has a different answer.
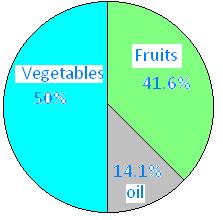
The problem with this picture is that all the numbers added up do not equal 100% rather 105.7% which has now messes up the results because now the numbers are inaccurate.