Week 12 – Absolute Value Functions

This week in Pre-Calculus 11 we started a new unit. This unit includes absolute values and how we can graph them. I will show you how to graph an abosolute value linear function. There are steps that we need to follow when dissecting an equation.

1. Graph the parent function

2. Find the y-intercept

3. Find the slope

4. Graph absolute value

5. Find the critical point (solution)


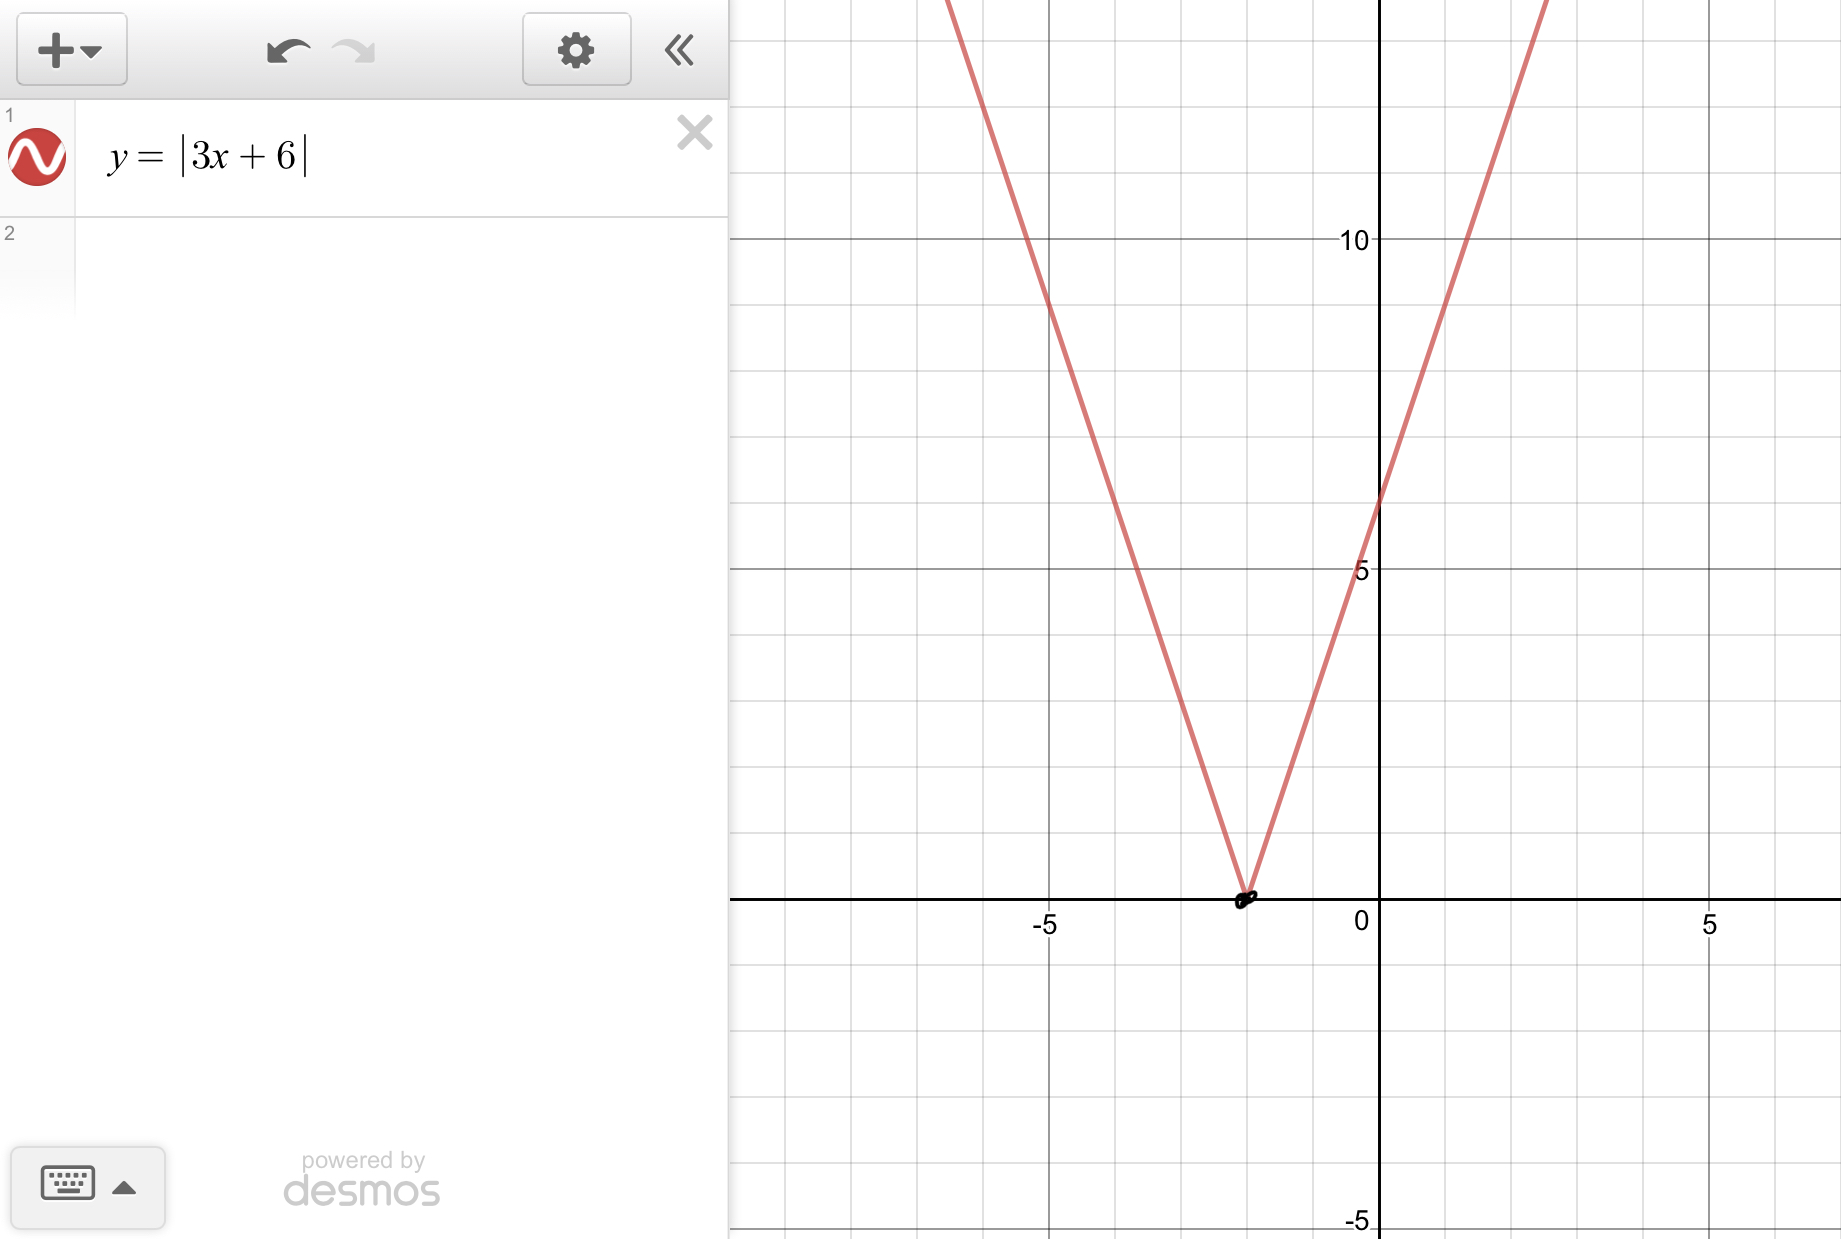
Something to look for when graphing linear absolute value functions is the x-intercept. This is important because the x-intercept is the critical point, the point where the graph changes direction. Some equations will have no solution which means they don’t touch the x-axis.


Week 13 – How to graph reciprocal functions

This week in Pre-Calculus 11 we learned about reciprocal linear and quadratic functions. We learned how to solve the functions algebraically and graphically. My preferred method is graphing to solve because it is a visual for me to see even though it is specific it helps work it out.

How to graph a reciprocal linear function:

1. Graph line (parent function)

2. Plot invariant points (y=1 or y=-1)

3. Asymptotes —> x-intercepts = vertical asymptotes

—> y=0 which is the horizontal asymptotes


How to graph a reciprocal quadratic function:

1. Graph parabola (parent function)

2. Invariant points (y=1 or y=-1)

3.Asymptotes —> x-intercepts = vertical (2 possible solutions)

—> y=0 which is the horizontal asymptote