This week I learned about the “slope man” which is a visual aid to help me figure out if the slope of a line, in graphing, is positive, negative, undefined, or zero. If a slope is negative, the line is decreasing and if a line is increasing, it is positive (shown by the eyes of the man). If a line is undefined, the line is straight and runs vertically up and down (shown by the nose). If a line is zero, the line is straight and runs from left to right horizontally (shown by the mouth).
Category Archives: Uncategorized
Math 10- Week 13
Math 10- Week 12
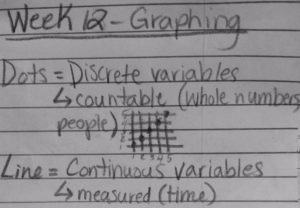
 One thing I learned this week, was when to leave dots on a graph or connect them with a line. If something being measured is countable, like objects, (for example; people, or candy) then the dots should be left the way they are. If the thing being measured on the graph is something that is measurable (for example; time), then the dots should be connected with a line.
Math 10- Week 11
Math 10- Week 9
This week we learned how to expand polynomials using an area model.
It is very similar to the method we used the previous week with expanding binomials. The only difference with this, is that it requires an extra 2 boxes on the end for the extra terms. We would add the middle like-terms like normal to get the expanded version.
Math 10- Week 6
This week I learned:
-a sphere is equal to 2/3 the volume of a cylinder
-a cone is equal to 1/3 the volume of a cylinder
-the volume of a cone is equal to the volume of a hemisphere
-the volume of two cones is equal to the volume of a sphere


