Data Visualization
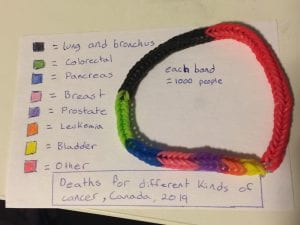
For my project of data visualization, I decided to make 2 different graphs to visualize my data on Pictochart, then I also made something out of RainbowLoom to help visualize my data.
The data I received was from the website statista.com and the data I found was data on the number of deaths from different kinds of cancer in Canada in 2019 alone. The data that I found on this website was already really easy to visualize in itself because it was organized by the different kinds of cancer in a bar graph so you could clearly see which cancers were killing people the most. What I did to help visualize this more was I inserted images of the part of the body cancer affects or just generally something linked to that kind of cancer because I found there were a lot of different kinds of cancers that I had no idea what they affected so it really helped me to have an image beside the graph showing where cancer affects the body.
Then because I didn’t want to just use this data because it didn’t show the people who got cancer but defeated it, I made another graph using the information from www.cancer.ca to find the number of males and females in 2019 that received cancer and also the males and females who passed away from cancer. I found a really good way to represent this data was by using a stacked Venn Diagram because it shows the group of the number of people that received cancer and then out of that group, the ones that unfortunately passed away.
Here is the diagram that I made:
After I made this Pictochart, I decided I wanted to represent this data in a physical way. So, I was at my house and found my old RainbowLoom and decided it was a good idea to make something out of this.
The following image is my end product:
As you can see from this picture, I had each band on the bracelet represent 100 people that unfortunately lost battles to cancer. Something to note on this representation is that whatever the number of people was, I would always round up to the nearest thousand and never round down. I felt like this was the right thing to do because this is representing people’s lives and I didn’t want anyone to be forgotten.
While doing this project, something that really surprised me was there weren’t as many people who passed away from breast cancer then I thought. I thought it would be the most popular type of cancer and it would be a much higher number then it is. The lung and bronchus cancer did surprise mt thought with the super high number and I did not know that many people suffered from it. My thinking for this is because in this day and age, there is a lot of people smoking cigarettes and vaping and those things have a huge impact on your lungs and it can cause lung and bronchus cancer. Also, when I did the stacked Venn diagram, I was extremely shocked at the survival rate of men and women with cancer. This is because the percentage of people who pass away is approximately 37% and so that means the survival rate is only 63% and I thought the survival rate was much higher than that. I know many people who have been affected by cancer including one of my friends at Riverside and I only know 1 person that passed away from Cancer and approximately 5 people that survived and so I was shocked at how lucky all the survivors are because only a 63% chance of living is not that high.
Overall I feel very happy with this project and feel like I did a good job because I created 3 different ways to represent the data I received. This project also opened my eyes to the different kinds of cancer and how they can affect people
The file below is the raw data I received from statista.com:
 Loading...
The website I got the data for my second graph on Pictochart is from www.cancer.ca
Here is the core competency I did:
 Loading...

