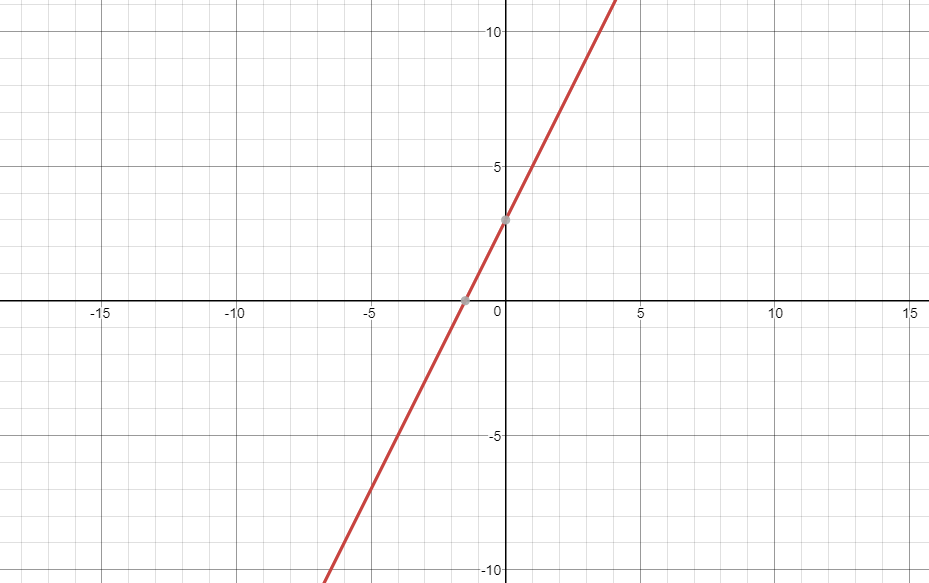
In previous grades, we learned about linear equations and inequalities with one and two variables, now we learn how to solve them graphically.
To graph a linear inequality with two variables we firstly rearrange it to y-intercept form in order to graph it.
EX: 2y+6<4x,
With y-intercept form of the equation, we are able to graph a line just how we did in grade 9.
The difference is in an equality the equation represent the values on the line and inequality represent a whole area.
A line will divide the graph into two zones, we just need to determine which zone to shade(it represent a range of value)
The most accurate way of determining such things is by trial and error,
we would take two test coordinates from each section of the graph and plug it into the equation, if the equation is true then the side with the coordinates will be shaded.
EX: (0,0) , (-5,5)
2(0)+6<4(0) 6 is not less than 4, therefore the otherside will be shaded.
One last thing you have to do before you submit your answer is to determine whether you should use a solid line or dotted line if the sign involves = sign, you use a solid line.(In this case it’a dotted line due to the fact that it’s only a < sign).

