a reciprocal of a number is the opposite of the number, or using the cool math language is 1/the number.
If you known fraction then you should know if 1/x and x<1, the number will become greater, and vice versa if x>1, the number will become smaller.
So in graphing, this will result in some very interesting observations.
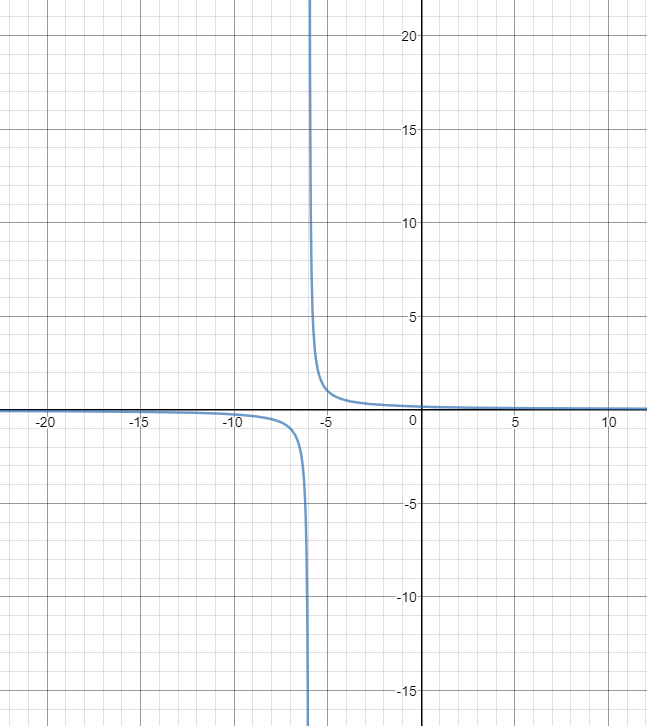
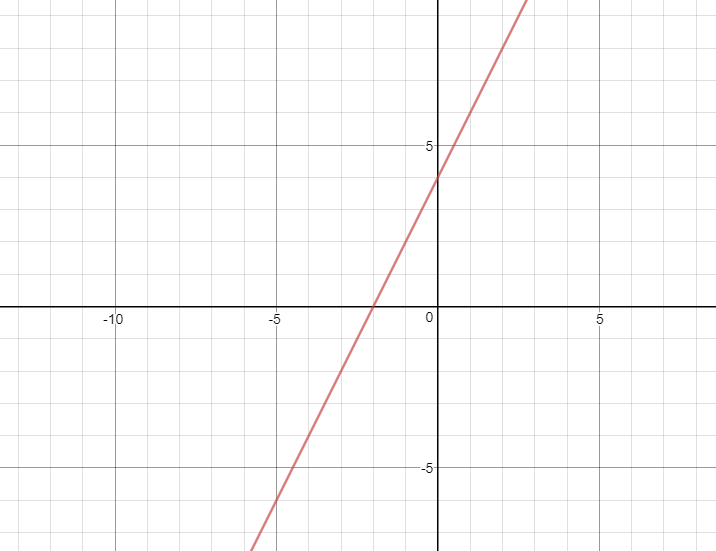
Let’s use this linear function as an example, x+6=y.
when you invert this function to 1/x+6=y, magical things will happen, ex:1/6+6=1/12, whereas the original function will yield 12. But this sort of magic has three exceptions, 1,-1 and o, as their inverse equals themselves, expect 0, as 0 can’t be divided by. With this information in mind, we will be able to determine how a linear inverse function.
Because when 1and -1 inverse their yield doesn’t change, so when y=1,-1 those x coordinates are called invariant points.
The second step in solving is to draw something called vertical asymptote, as we are in pre-cal 11 the horizontal asymptote will be 0, the asymptote is like a great wall that keeps the number on their own space because 0 can’t be divided. the vertical asymptote will always be the roots or the x-intercept.
With the asymptote and invariant points, we can basically draw the function just follow close to the asymptote in the zone where the original function has been and cross over the invariant points, you have successfully drawn yourself an inverse linear function.