In this week, I’ve learnt how to figure out which graph fits in a question.
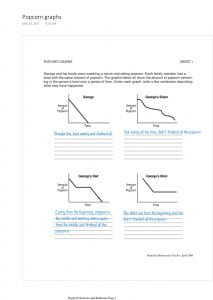
These pictures were our hw and I’m taking it as an example.
In this picture, the graph showed us the frequency of different people eating popcorn and did they finish the popcorn.
In this page, we can see that in different condition, the graph changes differently.
For example the first one, the roller coster was steadily going to the top and slid down fast to the other side. So when we have to find the representative graph, the line have to be stable at first and steep at the end.
Another example taken from the third one, The balloon slowly filled up by air because the students are blowing it up. They let it go and fly around thus it loses the air. Therefore, we we are looking the representative graph, it should be slowly going up and back down. Finally there should be no more air in the balloon, so the line won’t be able to go all the way to the end.


