5 Keys to Your Math 10 Success

Here are 5 things that will help you in Ms. Pahlevanlu’s math 10 class.

1. Do the blog posts. Yes they’re not that interesting but it’s best not to let them accumulate.

2. Listen. Ms. P’s lessons are really not hard to follow and don’t usually take that long. So at least pay attention so you don’t have to re-learn the lesson later.

3. Don’t stress. As the daily homework is not checked it is up to you how prepared you want to be. So don’t over-exert yourself doing extra practice if you don’t need it.

4. Ask for help if you need it. Ms P is very approachable and you have lots of class time to get the help you require.

5. Study. The tests aren’t ridiculously challenging bu to succeed or obtain the mark you would like you will need to study or have a general knowledge of what you are learning.
Week 15 – Slope

The slope of a line segment is the steepness of the line. It is the ratio of the rise (vertical) over the run (horizontal).

Horizontal lines have a slope of 0, and vertical lines have an undefined slope.

In math, slope is represented by the letter m.

Slope Formula: The slope of a line can be determined even without the graph as long as you have the two points and the slope formula. The formula is as follows:

M= \frac{y2-y1}{x2-x1}

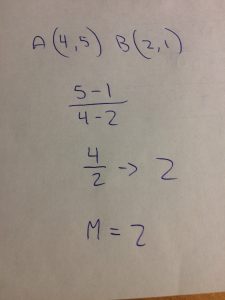
Example: Determining the slope of points A (4,5) and B (2,1)

Week 14 – Distance Formula

This week in math we learned about the distance formula in regards to relations and how to determine the length of a line segment.

The distance formula works as follows:

This may look complicated however it is really just the Pythagorean theorem with the line segment lengths formulas plugged in.

The following diagram shows the Pythagorean theorem well:

Example: Determining the length of A (3,4) to B (8, -2)

Week 13 – Domain and Range

This week in math 10 we learned about the domain and range of a relation. The domain of a relation is all possible values that can be used as the input of the independent variable and the range is all possible values that can be used as the output of the dependent variable.

Also when working with graphs, remember that x-values = input values, therefore x-values = domain, and y-values = output values and y-values = range.

When using brackets there are two different sets with two different meanings:

Closed brackets: Equal to –  [ ]

Open brackets: Not equal to – ( )

Example: When working with graphs or ordered pairs, the domain and range can be determined by listing the inputs and outputs.

Ordered pairs:

(1,3), (-2,4), (3,5), (7,8),

D: {1, -2, 3, 7}

R: {3, 4, 5, 8}