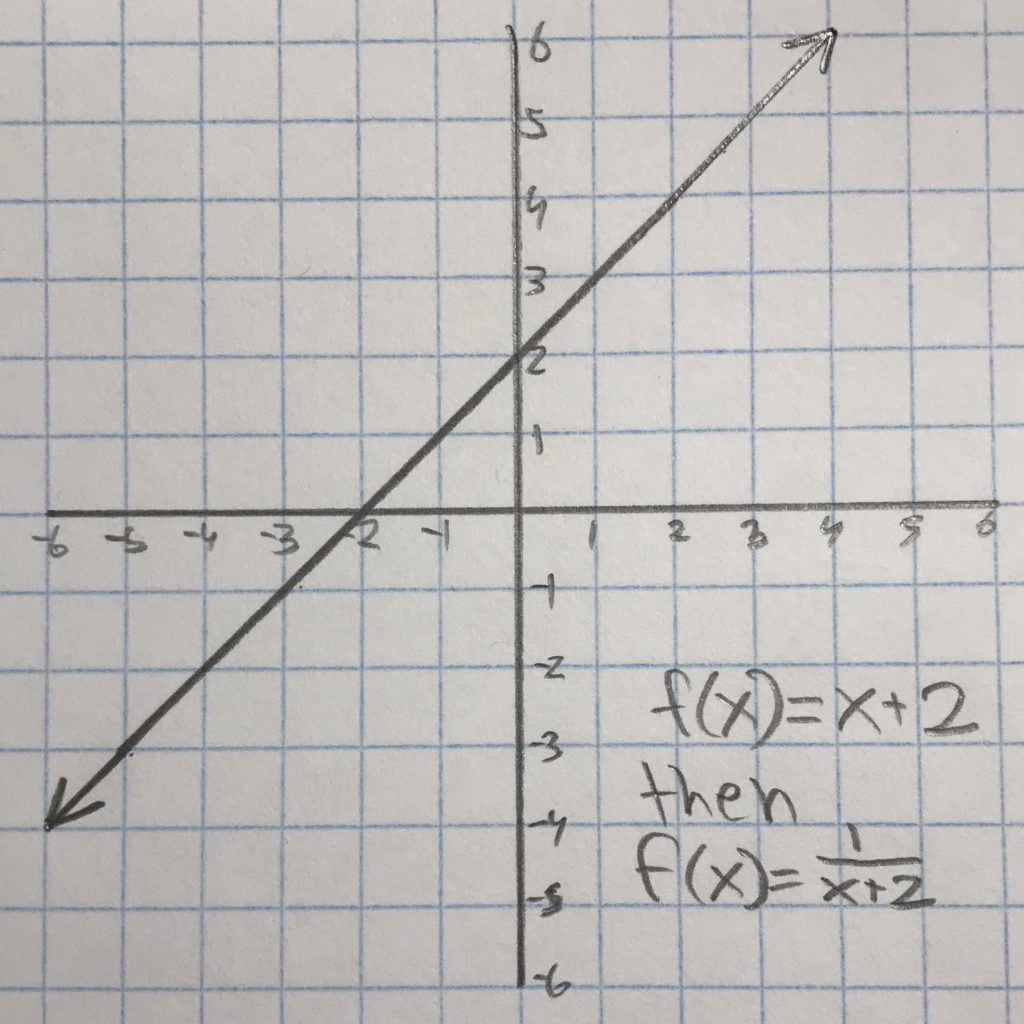
Week 13: Graphing Linead Reciprocal Functions

This week I learned about graphing reciprocal functions.

Step 1: Graph the linear function:

Step 2: Identify the asymptotes by first identifying the invariant points (the invariant points are always at the 1 and -1 y-axis points on the linear function, the asymptote goes directly through the middle of the invariant points, the other asymptote is always on the x-axis).

Step 3: Graph the hyperbolas:

Week 12: Solving Quadratic Systems of Equations

This week I learned about solving quadratic systems of equations.

A linear-quadratic system can have 3 possible solutions:

1) 2 solutions (line intersects parabola at 2 points)

2) 1 solution (Line intersects parabola at 1 point)

3) 0 solutions (line doesn’t intersect parabola)

A quadratic-quadratic system could have 4 possible solutions:

1) 2 solutions (parabolas intersect at 2 points)

2) 1 solution (parabolas intersect at 1 point)

3) 0 solutions (parabolas don’t intersect)

4) infinite solutions (parabolas are on top of one another)

How to solve a quadratic-quadratic system graphically:

Step one: Identify clues from the equations

Step two: graph the equations

Step three: Identify the intersects

The parabolas have 2 solutions (-2,-2) and (2,-2)