Tech Team Reflection 2018

I helped a lot this year. I feel like a did a lot more this year than compared to last year. Where there was about three events that I could participate in, this year I could take part in a large number and I feel like I was valued. I was part of the 2017-2018 boot camp, I helped at the tech night to show parents what devices they should buy their kids for school. And my favourite, I started working alongside Mr. Shen and learned important things regarding computers, information technology, and even some life lessons.

This year, I feel like an important part of the tech team. A reason why I’m grateful that I joined the tech team is that it opened up the opportunity to take part in the Make with Microsoft Program. I learned a lot and I got an amazing opportunity to be not a consumer, but a producer on the BCTech Summit floor.

Pre-Calculus 11 Week 18 – Top Five from Pre-Calculus 11

I’ve learned a lot this year in my math class. This blog post is dedicated to the top five things I’ve learned.

1. Geometric Sequences and Series

Geometric Sequences and Series are pretty cool. You can do some fancy math magic with the formulas. A geometric sequence is when each term after the first term is multiplied by a constant to determine the next term. For example, the sequence “2, 4, 8, 16, 32” is geometric. The common ratio is what the number is being multiplied by. In this case, it is four. The formula to determine a term in a geometric sequence is t_o=ar^{n-1}s=3, with a being the first term, and r being the common ratio.

While a geometric series is when you add all the numbers together up to a certain term. For example, in the geometric series “3, 9, 27, 81”, S_5 is 363. You can calculate geometric series with the formula

2. Graphing Absolute Values

Image result for absolute value graph


Graphing an absolute value is pretty cool. It’s almost just like a regular graph, except anything below the x-axis is

reflected above the x-axis. They look pretty neat, and you can do this with linear and quadratic equations! An equation with absolute values looks something like y=|x+3|.

3. General Form, Standard Form, and Factored Form

So there’s three different forms of quadratic expressions and equations. You’ve got general form, which is the one that we tend to see the most. You’ll remember it from grade 10. ax^2 + bx + c. Standard form is my favourite, as it is tends to give you the most information. You can see the scale, the horizontal and vertical translation, the vertex, the axis of symmetry, and more! It’s represented with (x + p)^2 + q. Factored form can give us the solutions to the parabola, which is a fancy word for where the parabola intersects with the x-axis. Factored form looks like (x +x_1)(x+x_2)

4.  The Quadratic Formula

x=\frac{-b\pm\sqrt{b^2-4ac}}{2a}

That’s a mouthful, isn’t it? The quadratic formula is used what you have a quadratic expression that just does not factor nicely at all. While you’ll get answers like x=\frac{-1\pm\sqrt{47}}{3}, it’s actually the nicest answer you’re going to get without a calculator. It’s also the exact answer, since if you put your answer down in decimal, you’re actually rounding off numbers, meaning your answer is inaccurate.

5. Graphing reciprocal functions

They’re SUPER weird. But they’re kinda cool. Reciprocal is a fancy word for flip. For example, the reciprocal function of x+4 is \frac{1}{x+4} Now describing what it looks like is near-impossible to describe… So take a look at it below. It’s scary, and after grade 11 is over, I want nothing to do with it for three months..Image result for reciprocal function

Pre-Calculus 11 Week 17

This week we covered just about everything in our Trigonometry unit, so I am going to attempt to put as much as I can into this blog post.

SOH CAH TOA is updated for x, y and r. I’ll explain.

Sine = \frac{Opposite}{Hypotenuse} is now sine = \frac {y}{r}

Cosine = \frac{Adjacent}{Hypotenuse} is now cosine = \frac{x}{r}

And Tangent = \frac{Opposite}{Adjacent} is now tangent = \frac{y}{x}

The best way to remember these, is to simply remember that sine is \frac {y}{r}. You should know that the hypotenuse is \frac{x}{r}, so

So where the heck did x, y  and even come from? Prepare to be introduced to reference angles and unit circles!

Image result for unit circle trig

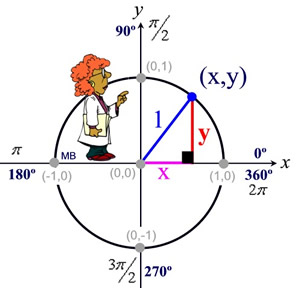
Rotation angle is different from reference angle. Rotation angle is how far the terminal arm has rotated from the rest position, 0^o.

Image result for reference angle trig


The reference angle is always going to be beside the x-axis. And then from here, we can find out which lines are the

adjacent and opposite lines. Then we can find out which trig ratio to use. For example, the reference

angle for a rotation of 160^o degrees is 20 degrees, because the angle needs 20 more degrees to reach the x-axis. Or, a 225 degree angle has a reference angle of 45 degrees, because it needs to lose 45 degrees to reach the 180 degrees point.

Now, there are special triangles that you should remember as well. These let you do trigonometry without a calculator, and it can also be a way to double check your work.
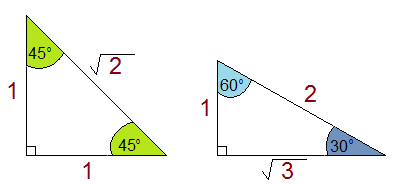
Image result for trig special triangles

Say, you wanted to find sin 45^o. First, you’re dealing with a 45 degree angle, so you know you’re gonna look at your isosceles right triangle. You know sin is \frac{y}{r}, so that means sin45 is \frac {1}{\sqrt{2}}

Or, you want to know cos 60. You know cos = \frac{Adjacent}{Hypotenuse}, or what we’re really supposed to remember, cos = \frac{x}{r}. This means cos 60 = \frac{1}{2}


But obviously, you’re not going to deal only with triangles that have side lengths of 1, 2, and \sqrt{3} units.

How do we fix this?

Well, do you remember similar triangles? From grade nine? I’ll refresh you just in case. If two triangles have the same angles, then that means the only difference between the two can be the size, or the side lengths. This means, if you run into another triangle that has angles of 30, 60, and 90 degrees, but has side lengths of 4, 4\sqrt{3} and 8, then you simply have to find the scale factor! The scale factor in that triangle that I described above is 4. If you divide all side lengths by 4, you’ll get our 1-\sqrt{3}$-2 sides again.

Pre-Calculus 11 Week 16 – Trigonometry Review

We finished our Rational Expressions and Equations test this week, so we’ve started our new unit. Trigonometry. So I’m gonna post everything I remember from Trigonometry in grade 10.

Image result for triangle trig

In a right triangle, the side closest to theta that isn’t the hypotenuse is the adjacent side. The side farthest is the opposite side, and the hypotenuse remains the same, like always.

Remember SOH CAH TOA

SOH is Sine = \frac{Opposite}{Hypotenuse}


CAH is Cosine = \frac{Adjacent}{Hypotenuse}


TOA is Tangent = \frac{Opposite}{Adjacent}


To find an angle when you have the lengths of two sides, you can use the inverse of sine, cosine, or tangent. Image result for triangle sidesSay you had this triangle. You want to find the angle of B. Well, that makes the 5cm side the opposite side, and the 7cm side the hypotenuse. We don’t know how long the adjacent side is, so we can’t use that. So which ratio can we use? We can use Sine, because Sine = \frac {Opposite}{Hypotenuse}

So to find the angle of B, we take the inverse sine of 5/7.


And of course, with some algebra skills, you can also also find the length of one side if you have the length of another side and an angle.

Don’t forget, you can also use the Pythagorean theorem to find the length of another side if you need to.

Pre-Calculus 11 Week 15 – Solving Rational Equations

This week, we solved rational equations

Note that this is different from last week, where we only simplified rational expressions.

Simplifying looks like this:

\frac {x^2+5x+6}{x+3}


\frac {(x+2)(x+3)}{x+3}


x+2

And solving looks like this:

\frac {x^2+5x+6}{x+3}=


\frac {(x+2)(x+3)}{x+3}


x+2


x = -2


The major difference here is the equal sign that is present when solving vs no equal sign when simplifying.

A common issue with solving ration expressions is how to add together two or more fractions when they have different denominators. Simply remove the denominator like so

\frac {x-1}{x-3}= \frac{x+1}{x-4}


\frac {(x-1)(x-3)(x-4)}{x-3} = \frac {(x+1)(x-3)(x-4)}{x-4}


x^2-4x-3 = x^2-2x-3


= 0=3x-7


3x=7


x = \frac {3}{7}

My Time at the Microsoft Garage and the BCTech Summit

Recently, I got invited to join a pilot program started by Microsoft. It involved working with my peers from my school, and knowledgable mentors at Microsoft. The goal of the program was for the four of us (Me, Sara, Marcus, and Paige) to create a product that we could present at the BCTech Summit, all under our mentor, Stacy Mulcahy. It started off with us brainstorming a number of ideas. We got to play with the tech that they had at Microsoft, and that included 3D printers, Hololenses, and Mixed Reality/Virtual Reality headsets.

While the promise of developing something for virtual reality seemed enticing (And dear god, it really was), we also wanted to create a product that could help people who used it. After taking a day to brainstorm, we wanted to make something that could improve a user’s mental health. We decided to create a smart mirror that would detect the emotion that the user is feeling, and then react and give help on how to deal with that emotion.


Over the course of a month and a bit, we came to the Microsoft Garage in our own free time to work on developing the software to detect the users emotion, and the hardware to house everything. I worked on the software with our mentor Stacy Mulcahy. She taught me basic coding with JavaScript, how to add APIs, and how to use Visual Studio and GitHub. Marcus and Paige worked on creating a box to house the mirror. Stacy also ordered some 2-way acrylic panels for us.

The prototype was a taken apart monitor that was connected to a raspberry pi, which is all stored inside of the box. We have a keyboard and mouse connected to the prototype, but later, we would like it to be touch/voice activated. The monitor/pi is stored inside the box, and the two-way acrylic covers the monitor to create the smart mirror functionality. There is also a camera attached to the top of the mirror that scans the person sitting in front of it and sends the face to the API to get it analyzed. Once it’s analyzed, the information gets sent back to the mirror, which is displayed in the ultimate form of millennial communication: an emoji.

We’re super proud of what we created. Being able to proudly walk into the showroom, and talk to all these amazing people in the tech industry about what we built was an amazing feeling.

Pre-Calculus 11 Week 14 – Simplifying Rational Expressions

This week, we started a new unit. This unit is on rational expressions.

A rational expression you might find in grade 11 is \frac{(x+2)(x+3}{(x+2)(x-2)}

To simplify this expression, we find anything common between the numerator and denominator. In this case, the binomial (x+2) exists in the numerator and denominator. So we can cross it out, and our final answer is \frac{(x+3)}{(x-2)}

What if you had quadratics as your numerator and denominator like \frac{x^2+x-6}{(x-2)}

Well, we can factor the quadratic into (x+3) and (x-2). What do you see now? Now our rational expression can be simplified!

\frac{(x+3)(x-2)}{(x-2}


(x+3)


However, if you have a rational expression like \frac {x+3}{x+2}, remember that this cannot be simplified any further. This is it’s final form! You cannot take away the from the numerator and denominator, as tempting as it is. If you follow through with it, your answers will be wrong. So beware!


Pre-Calculus 11 Week 12 – Graphing Absolute Values as a Linear Function

This week was absolute values! An absolute value describes how far a number is from zero. When a question asks for an absolute value, it looks like this: |6|

Not that hard. How far is the number six from zero? Well, six. What about |-5|?

|-5| = 5 because -5 is five away from zero. That’s all there is to it.

Now, how do we graph an absolute value? A rule that should be remembered is that there will never be a part of your graph below the x-axis. If your graph is below the x-axis, that means your number is negative, which is wrong. Because absolute values are never negative.

Below is a table and a graph for the function y = x + 1 and y = |x + 1|.

See how the line practically bounces off of the x-axis? This is how an absolute value looks when it is graphed. The red line represents y = |x + 1| and the black line shows what the line would look like if we weren’t looking for the absolute value. The black line is y = x + 1.

Pre-Calculus 11 Week 13 – Graphing Reciprocal Functions

Aight, this is really crazy, you’re gonna wanna strap in.

Imagine this function. It’s an easy one. f(x) = x

Nothing you haven’t seen before. The y-intercept is even zero. Easy peasy. Now this graph  is probably rustling your jimmies, and that abomination is what we call a reciprocal function. In fact, this is the reciprocal of f(x) = x. That

one in particular looks like this: f(x) = \frac{1}{x}

Quick reminder that when we’re asked to reciprocate something, it means the numerator and denominator switch places. In every whole number, there’s always a number 1 as it’s denominator. It’s just invisible. So when we’re asked to reciprocate 3, it becomes 1/3. In the case when we’re asked to reciprocate a function, the whole thing becomes a denominator. So to reciprocate f(x) = x+3, it looks like f(x) = \frac{1}{x+3}

Also good to know is that those bendy lines that are defying the laws of everything you know are called hyperbolas.

So you’re probably wondering: how the hell am I supposed to graph that thing? Well, good question! First, we’re gonna pretend that it’s not a reciprocal function. Let’s attempt to graph f(x) = x Just a diagonal line, nothing special. Now, we’re gonna label some special points.

We need the asymptote, which is an invisible line/fence/great wall that the graph can never cross over. There’s gonna be at least one for x and one for y. There can be more than one on the x-axis, but that’s for another blog post. The asymptote is going to be wherever the line crosses the x-axis. In this case, the asymptote is going to be x = 0. For the y-axis, the asymptote is always going to be y = 0. Don’t fight it, it just is. It’ll change in grade 12, but don’t worry about it. The x-axis asymptote is the red vertical line.

Now the last thing we need to find are the other special points the invariant points. To find the invariant points, take y = 1 and y = -1 and find wherever it would be on your line. I’ve marked them in green on the graph. In the case of this line, our invariant points are (1,1) and (-1,-1).

Now from here, draw your hyperbola, make sure it intersects with your cool dude points, and WHATEVER YOU DO, DON’T LET THE CURVE CROSS THE ASYMPTOTE. Now, I love accuracy as much as the next pre-calc nerd, but as long as your teacher sees a curve, and that you haven’t crossed the asymptote, your graph is golden. Draw a t-chart if it makes you feel any better, but generally, this is what most reciprocal graphs are gonna look like. They’re translate to the left and to the right if their b value, or the y-intercept is higher or lower, and the hyperbolas can be farther or closer to each other depending on the slope.

Pre-Calculus 11 Week 11 – Graphing Inequalities with a Degree of 1


We started our inequalities unit this week. If you were told how to graph y=x^2+2, I’m sure you’d be able to graph it. Or y=2x-3? What if I asked you to graph y\leq x+2 How do you graph that?

First, lets refresh what inequality signs mean. The \geq means “greater than or equal to”. For example, 5\geq 2 or 3 \geq 3. While the \leq means “less than or equal to”. For example, 5\leq 7 or 5 \leq 5.

Now that we’ve got that out of the way, now we learn how to graph  an inequality. It’s just like graphing a linear equation, just with an extra step. In y \geq 2x+3, we can see that the inequality is in our slope-intercept form, which you probably learned back in grade 9. Our slope here is 2, and our y-intercept is 3. Make your starting point on the graph your y-intercept, and then draw your slope.

To show our inequality, we highlight the side of the graph, where if we use a point from that highlighted side, the inequality statement will be true.

Okay, okay, that was a mouthful. Just, keep with me, here.

Our last step involves using a “test point”. Now that we’ve graphed our line, we’ve split the graph into two parts. Pick a point that is clearly on one side of the line, say, (-5, -5). Insert the coordinates into your inequality.

y\geq 2x+3


-5\geq 2(-5)+3


-5\geq -7


If the statement is true, then that means for the inequality statement to be true, you have to insert the coordinates for any point that is on that side. If you got a false statement, that means that the other side is correct! Then you just highlight the correct side.