This week we learned how to solve and graph inequalites. I choose this subject because it was an interesting application of algebra and solving with quadratic equations
I learned how to solve and graph linear inequalities
1. * Start by identifying the linear inequality in the form ,
,
, or
, where
,
, and
are constants.
2. Solve the inequality for \(x just like you would solve an equation, using inverse operations. Remember to reverse the inequality sign if you multiply or divide by a negative number.
3. Represent the solution on a number line. Use an open circle for or
inequalities and a filled circle for
or \( \leq \) inequalities. Shade the region to the right for
or
inequalities and to the left for
or
inequalities.
Example:
Let’s solve and graph the inequality .
1. Identify the inequality: .
2. Solve for : Subtract 3 from both sides to get
, then divide by 2 to get
.
3. Graph the solution: On a number line, put an open circle at 2 and shade to the left.
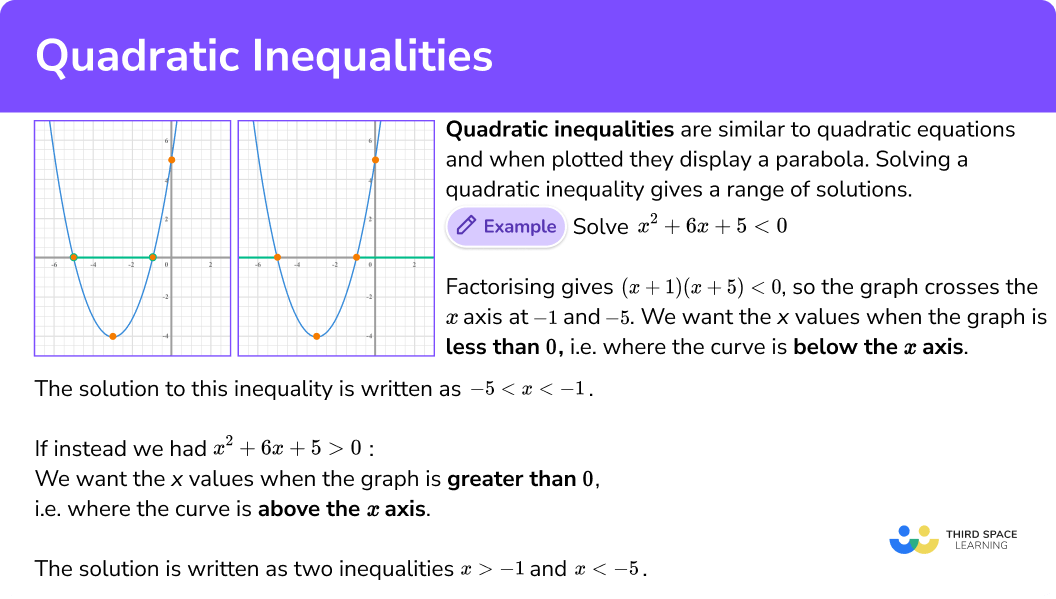
**Quadratic Inequalities:**
1. Identify the quadratic inequality in the form ,
,
, or
, where
,
, and
are constants.
2. If possible, factor the quadratic expression to find its roots. If factoring is not possible, use the quadratic formula to find the roots.
3. Use the roots to determine the intervals where the inequality is true based on the signs of the quadratic expression within those intervals.
4. Represent the solution on a number line, using open or filled circles depending on whether the inequality is strict or non-strict, and shade the appropriate intervals.
Example:
Let’s solve and graph the inequality .
1. Identify the inequality: .
2. Factor the quadratic:, so the roots are
and
.
3. Determine intervals: The intervals to consider are ,
, and
. Test a value from each interval to determine the sign of the expression in that interval (e.g.,
) gives a positive value,
gives a negative value, and
gives a positive value).
4. Graph the solution: On a number line, use open circles at 1 and 3 and shade the intervals where the inequality is true (to the left of 1 and to the right of 3).
These steps should help you solve and graph both linear and quadratic inequalities effectively.
Here are the steps to graph quadratic inequalities