Absolute Value vs. Reciprocal Function Graphed
This week in math we learned what an absolute value and what a reciprocal function when graphed looks like.
Both have similarities but also many differences.
Both an absolute value graph and reciprocal function graph can either be linear or quadratic.
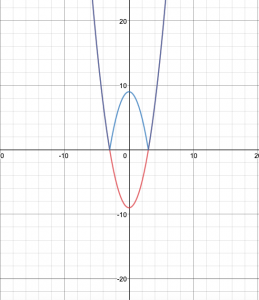
An absolute value graph looks either like a V or W if quadratic and the graph is never in quadrants 3 or 4 due to the fact it is an absolute value meaning there can be no negatives. As well as there is critical points. Critical points are the X-intercepts and where the graph starts to reflect. Below are the different types of what an absolute value graph may look like.
Linear:

Quadratic:
On the other hand, a reciprocal function graph if linear has 2 invariant points (0, 1) and (0, -1) and one vertical asymptote which is the X-intercept. If the graph was quadratic it will have 0-4 invariant points and 0-2 asymptotes (X-intercepts). Both a linear and quadratic reciprocal function graph hyperbolas are created which follow the asymptotes before hitting the invariant points and then follow back to the asymptote. Below are the different types of what a reciprocal function graph can look like.
Linear:

Quadratic:

