Name: Nicole Tran
Date: April 22, 2019
Title: The effect of temperature on lactase reaction rate
Purpose: to determine how the temperature affects the reaction rate of enzyme, specifically lactase.
Curiosity Questions: Will lactase be active enough to break down lactose at very low temperature (<10)? Will one drop of lactase be too much or too little for 10ml of milk in 5 minutes so that the data can be correctly recorded?
Hypothesis: If the temperature increases, the reaction rate of lactase will increase and more glucose will be produced. However, if the temperature increases over 45 degrees, the reaction rate will drop and less glucose is produced.
Null hypothesis: If the temperature increases, the reaction rate of lactase won’t be affected and the amount of glucose being produced stays the same.
Materials:
- 5 test tubes
- 5 beakers
- Test tube rack
- Milk
- Graduated cylinder
- Lactase (drop)
- 5 Glucose test paper
- Ice bath
- Hot plate
- Thermometer
Procedure/Methods:
- Measure 10ml of milk using the graduated cylinder and pour it into each test tubes.
- Heat/Ice bath the milk until it reaches the following temperature. The temperature for each tube is 5, 10, 37, 45, 60 Celsius.
- Add water with the corresponding temperature in the beakers and place them under the test tubes so that the part of the test tubes containing milk is submerged in the water. If the temperature of the water is reached by mixing boiling water with room temperature water, pour the room temperature into the beaker first, then carefully pour the boiling water in until it reaches the desired temperature to avoid hot water splashing.
- Add 1 drop of lactase into each test tube.
- Frequently check the temperature of the solution to make sure that the temperature of the milk is maintained. Remember to wait for the temperature to return to room temperature before taking the next measurement.
- After 5 minutes, dip the glucose test papers into the solution – one test paper per test tube.
- Compare the colour on the glucose test paper to the colour chart on the glucose test paper container.
Data + Observations:
Data table: The concentration of glucose in relation to temperature
| Temperature (Celcius) | The concentration of glucose (mmol/L) |
| 5 | 0 |
| 10 | 10 |
| 37 | 111 |
| 45 | 55 |
| 60 | 6 |
Graph Temperature vs Glucose (based on the data from the experiment)
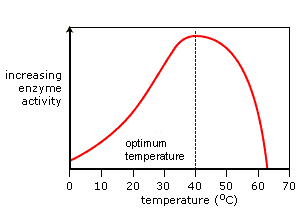
Ideal graph: Enzyme activity vs temperature
- The concentration of glucose increases from 0 to 111 with an average rate of 3.47 mmol/L/C when the temperature goes from 5 to 37
- The concentration of glucose decreases from 111 to 5 with an average rate of 4.61mmol/l/C when the temperature goes from 37 to 60
- The concentration of glucose is highest at around 37 degrees, with over 111 mmol/L
- The rate of decrease in the concentration of glucose is greater than the rate of increase in the concentration of glucose.
- The graph attained from our data shows a similar trend to that of an ideal graph. Yet, the rate of change in the two graphs is different.
Analysis & Conclusion:
- Answer to curiosity question: For the first question, according to the experiment, at 5 degrees, there is no glucose being produced. However, the data is based on a 10 minutes interval. Thus, there is a possibility that glucose will be produced if the solution is left for a longer period of time. For the second question, one drop of lactase is enough for 10ml of milk in 10 minutes. We were able to collect the data that are distinctive from one another instead of relatively similar (since the colour has a maximum point, if all of the results reach the maximum point, the data doesn’t prove anything.)
- Analysis: when the temperature rises, there is more kinetic energy in the molecules. Thus, the molecules move faster and bond to the enzyme more frequently, resulting in an increase in reaction rate. However, the temperature above 45 degrees would cause the enzyme to denature, because the apoenzyme is a protein. Therefore, the enzyme cannot effectively participate in the reaction, resulting in a decrease in the reaction rate. There is glucose at 60 degrees because high temperature also causes the protein in the milk to denature, forming glucose and galactose.
- Conclusion: As the temperature increases from 0, the reaction rate gets faster. The reaction rate is fastest around 37 degrees. When the temperature keeps increasing, reaches 45 degrees and over, the reaction rate drops dramatically.
Errors/ Improvements:
- The temperature can fluctuate during the process. The thermometer cannot inform the change in temperature immediately, and we cannot adjust the temperature immediately. We can decrease the error by using a machine to keep the temperature stable like the sous vide machine use in cooking.
- The data is based on the colour of the glucose test paper, which isn’t a quantitative measurement. Therefore, there is a range for error when perceiving the colour from the glucose test paper. One way to correctly read the colour is to measure it using a colorimeter, which converts the colour into a number.
- We should have use pipettes to measure the amount of milk because it is more accurate than measuring into a graduated cylinder

