This week I learned how to graph an absolute value of a quadratic function with a linear equation.
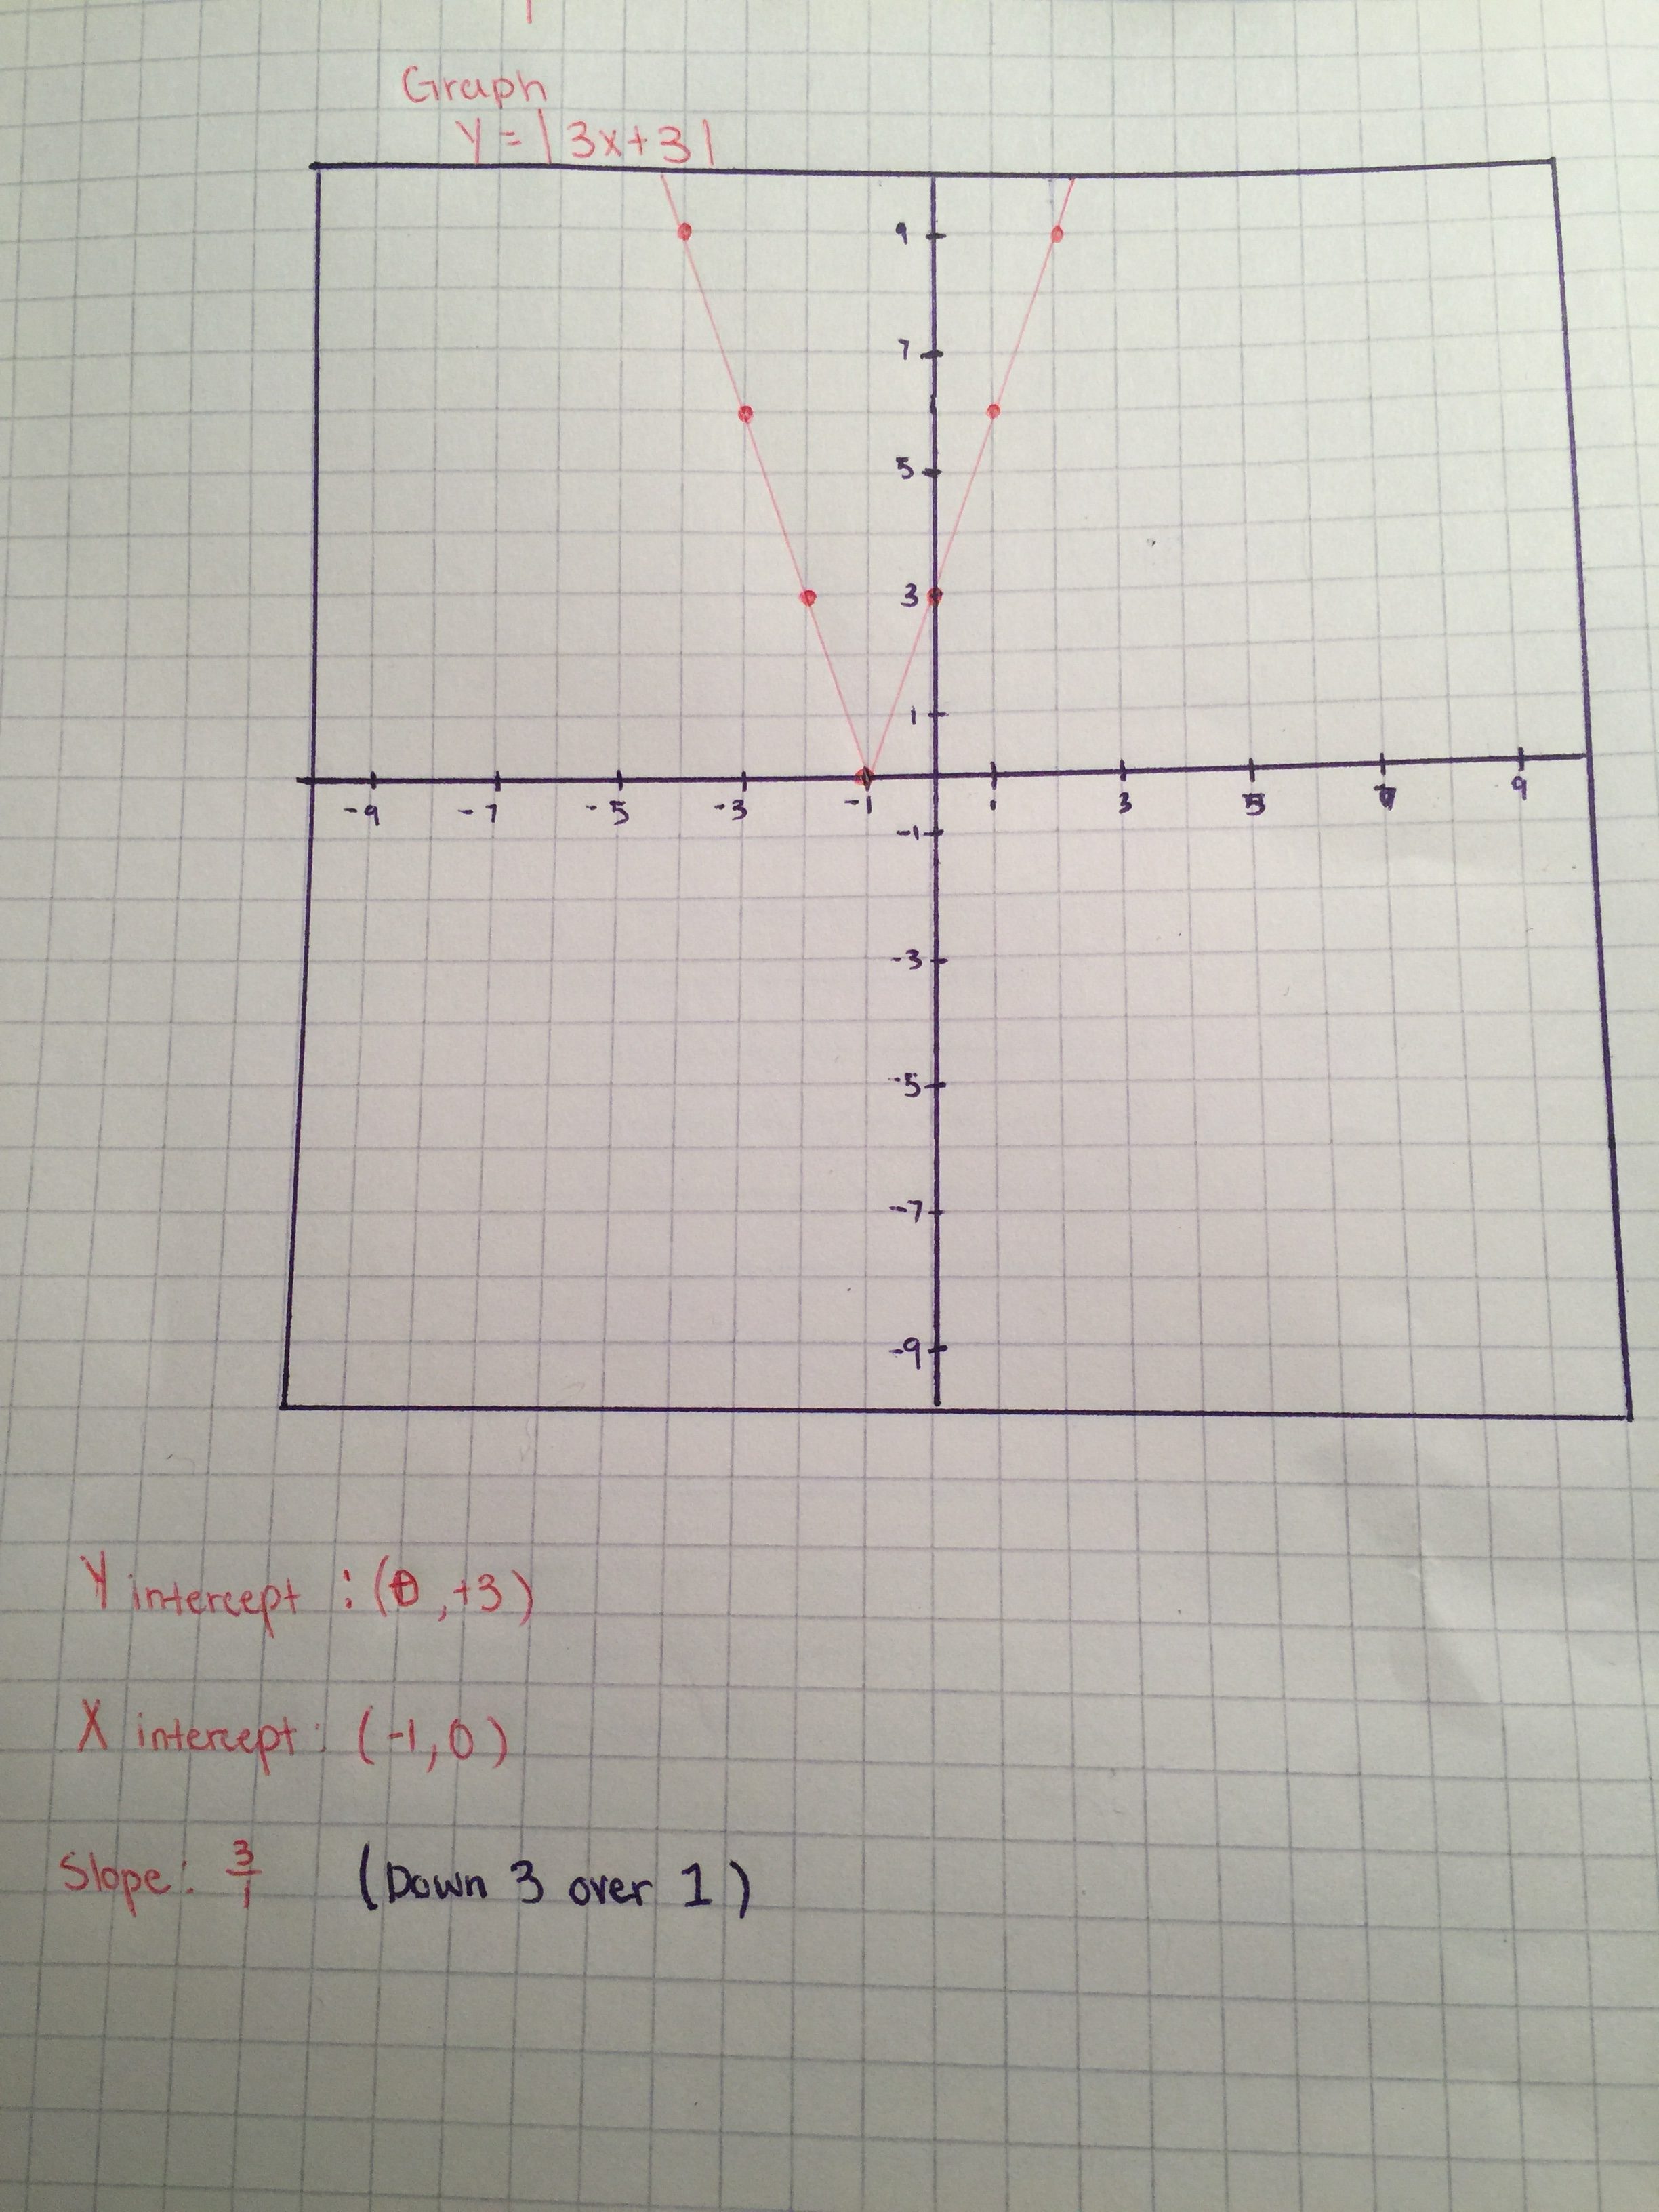
Given the equation ![]() , start by plotting the y intercept which is +3. Then find the slop which is
, start by plotting the y intercept which is +3. Then find the slop which is ![]() a rise of 3 and a run of 1. Once the graph hits the x-axis it reflects and continues the graph but with the opposites plots of when it would be below the x-axis.
a rise of 3 and a run of 1. Once the graph hits the x-axis it reflects and continues the graph but with the opposites plots of when it would be below the x-axis.