Precalc 11 – Week 15

This week in Precalc 11 I learned about adding, subtracting, multiplying, and dividing rational expressions.

For all of these, the main point is to find a common denominator, which can be found by either multiplying the denominators together or finding their lowest common factor.

For multiplication, it’s the most straight forward. You just multiply the terms in the numerator normally.

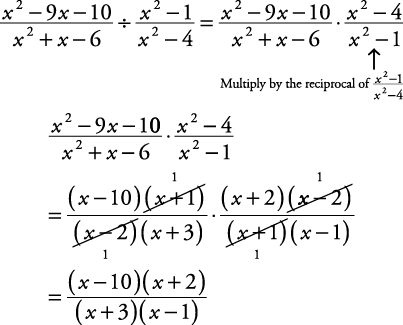
When it comes to division, you’ll need to flip the second fraction so it can be multiplied instead, and continue like you would with multiplication.


With addition, after finding a common denominator, you add up the numerator as you normally would with common terms.

Finally, with subtraction, once you’ve gotten your common denominator you subtract the common terms like normal.

For any of these, simplify when possible.

Precalc 11 – Week 14

This week in Precalc 11 we learned about rational expressions and reducing them. A rational expressions is a fraction of integers, and is the main focus of this unit.

However, they can often include factors or larger terms, and it can be a lot of math to do. In order to avoid this, we have to reduce these fractions to the simplest terms. Yet, it’s not the same as a typical fraction. With normal fractions, we divide the numbers by the same number until they’re as low as possible.

With rational expressions that have large polynomials or factors, we have to start by factoring it if it isn’t. Then, you simply remove pairs of factors if they match, one from the numerator and one from the denominator. Whatever you can’t remove that way is in simplest terms.

Precalc 11 – Week 13

This week in Precalc 11 I learned about absolute value functions. Essentially, they start the same as a normal function, however, they cannot have a negative y at all.

To start, this means that all negative y intercepts are going to be flipped up to be positive, so -7 becomes 7.

Then comes the important part, as the line or parabola will likely hit the x-axis. If this is the case, the line or parabola will have a bounce point, causing it to start heading upwards again. This bounce point can also be found as the x-intercept. It’s always important to keep in mind, as under no circumstances will an absolute value function have negative y values.

Additionally, after the bounce point the line or parabola continues normally, simply in the other direction.

Image result for absolute value functions

Image result for absolute value functions parabola

Precalc 11-Week 12

This week in Precalc 11 I learned about graphing linear and quadratic inequalities.

First, linear and quadratic inequalities keep the same shape as equations, as they still include the base y=mx+b and $y=x^2$ however, the way to indicate them is different.

If the inequality has >= or <=, the line of the inequality will be solid, but if it’s only < or >, then it must be a dotted line.

Additionally, you shade in the side of the line or parabola that has the solutions. An easy way to figure out which side works is to use the test point 0,0. The reason this is usable is because 0,0 is not only a simple point to find, but by plugging it in to the equation, you can figure out if the side that includes 0,0 satisfies it or not. If the equation makes sense when using the point 0,0, then the side you shade is the one with 0,0. If not, then you shade the other side.

For example, if you have the inequality y<x+4, then putting 0 in will make it 0<4, which satisfies the equation, meaning you shade that side.

The same goes for a parabola, if you were to have the inequality y<x^2-3, you’ll be able to test it with zero as well.

Using these rules and tricks for graphing, you can put any inequality on to a graph.

Precalc 11 – Week 11

This week in Precalc 11 about solving inequalities with number lines and factors.

If you have an inequality, such as y>x^2+3x+2, you start by factoring it, in this case getting y>(x+2)(x+1).

Then, you find the zeros, which for this inequality are x=-2 and x=-1. You then place those zeroes on a number line.

Afterwards, you match each factor up to a number line, and find out whether each of the three segments on the line created by the zeroes are positive or negative.

Next, you combine each of those number lines by figuring out the positives and negatives on the overall number line. For example, if the middle segment on the first line is positive and negative on the second one, you’ll end up with a negative in the middle segment of the overall number line, as a positive and negative equal a negative when multiplied.

Then, you figure out whether your answer needs to be positive or negative and select a number within whatever segment needed.

With that, you have your answer. In this case, it’s x>-1 and x<-2.

Precalc 11 – Week 10

3 things I reviewed for the midterm were arithmetic and geometric sequences and series’, multiplying radicals, and completing the square for quadratic equations.

For the sequences and series’ I simply had to remember when to use each formula and how to find the proper pieces. As long as I had two terms or a term and a ratio or common difference, I was able to find the first term and any other term necessary. Afterwards, I could input that information into any series formula I needed. I also had to remember when I could use the infinite formula, which is only if x is in between 1 and -1.

For multiplying radicals, I had to remember the rules of multiplying them. If they’re the same term, you multiply the coefficients normally and then remove the root. If they were different radicals, you would multiply the coefficients normally but then multiply the radicals like normal multiplication as well.

As for completing the square, I needed to refresh myself on the steps taken. To start, I had to put brackets around the first two terms and if there was a coefficient for the x^2 I had to distribute it out. Then, I halved the middle term and then squared it, which gave me the third term within the brackets (which I also subtract outside the brackets). Afterwards, I factored what was in the brackets to be a perfect square factor, and simply solved from there with the completely factored numbers and last term that I could subtract.

Precalc 11 – Week 9

This week in precalc I learned that the completing the square form of an equation is the same as a general quadratic graphing equation, so if I complete the square I can easily fill in a graph.

If an equation is in standard factoring form, I can simply convert that to a completing the square form as well, allowing me to easily solve graphs so long as I can change the equation to what I need it to be.

Additionally, if an equation is already factored, I simply expand it, and continue on until I have completed the square.

Essentially, all I need to do is complete the steps to convert it to the right form, and the graph becomes easy to solve.

The form I need to find looks like this: y=a(x-p)^2+q

Precalc 11 – Week 8

This week in precalc, I learned about the standard form of quadratic equations and how every piece determines a part of its graph. It is an easy and effective way to graph any quadratic equation.

The standard form looks like this: y=a(x-p)^2+q

To start, the a will modify the width of the parabola, either expanding or compressing it. If a=1, the parabola will look like a regular parabola. However, if a>1, it will expand and look thinner, whereas if a<1, it will compress and look wider.

Next, there is the (x-p)^2, which determines the x value of the vertex. As the value of p increases, the vertex moves right, and as it decreases, it moves left.

Finally, you have +q, which determines the y value of the vertex. If the value of y increases, then the vertex will move upwards, and if it decreases, it moves downwards.

Additionally, if the right side of the equation is negative, the parabola will open down and have a maximum point. You can also plug in various points of the graph into the equation at x and y.

Precalc 11 – Week 7

This week in precalc, I learned how to tell if quadratic equations are real, equal, unreal, or unequal, using their graph.

For a graph to be real and unequal, it must have two x intercepts on a graph, giving it two real solutions.

For it to be real and equal, it must have one x intercept, giving it a single solution.

If it’s unreal and unequal, it will have no x intercept, giving it no real solutions.

Image result for real and unequal quadratic graph

Precalc 11 – Week 6

This week in Precalc 11 I learned the quadratic formula and its use. The formula is an easy way to solve most quadratic equations, and it looks like this:

Image result for quadratic formula

This formula can be input with the pieces of a quadratic formula if with the numbers being ax^2+bx+c=0

This formula can take a while to use in terms of calculations and inputting information, but its much more straightforward than factoring or completing the square. Additionally, it’s a great go-to if a calculator is at hand.