Pre Calculus 11 Week 11: Graphing Linear Inequalities in Two Variables

This week in week 11 we started Graphing Inequalities. The majority of this is related to our graphing from last year in grade 10 math.

Linear graphs are known as straight line graphs with the equation of y=mx +b.

m is the slope ( \frac{rise}{run} )                                                                                                            b is the y intercept

For example: y =\frac{1}{2}x + 6 on a graph looks like:

Now when graphing inequalities you have to find a sign that will have a true statement after you have chosen a point on the graph to substitute x and y.

\star Note that > and < are broken lines on the graph and \underline{<} and \underline{>} are solid lines like the above graph ( because it is equal to so it includes the line)

  • 0 < \frac{1}{2}x + 6 (greater than zero)
  • 0 \underline{<} \frac{1}{2}x + 6 (greater or equal to zero)
  • 0 > \frac {1}{2}x + 6 (less than zero)
  • 0 \underline{>} \frac {1}{2}x + 6 (less than or equal to zero)

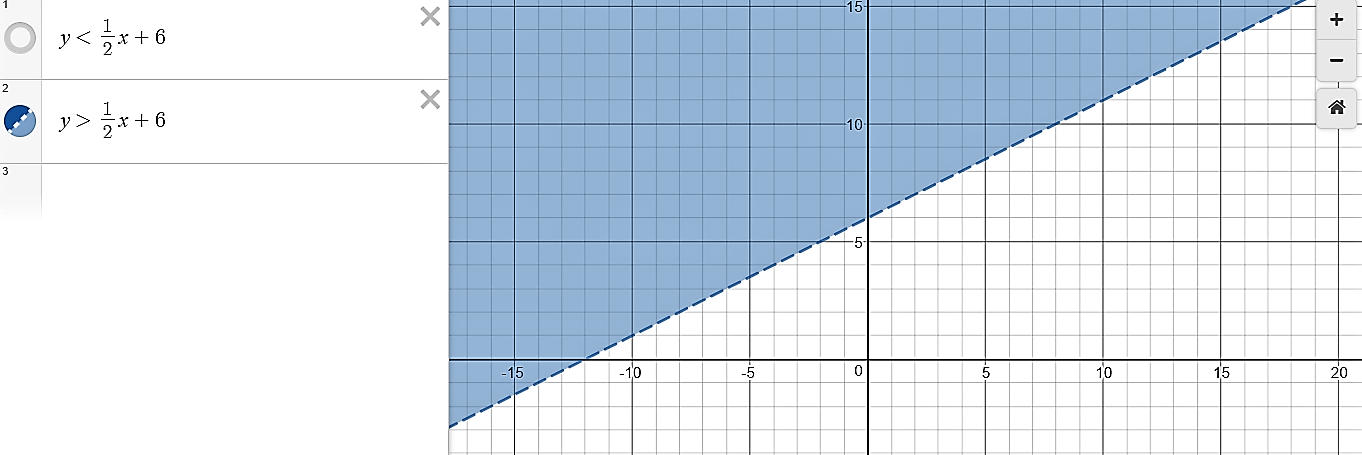
Now to graph the inequality you have to choose a point on the graph that makes the expression true for example:

y < \frac{1}{2}x + 6

\star to make things easy use (0,0) as the point

  •  y < \frac{1}{2}x + 6
  •  0 < \frac{1}{2}(0) + 6
  • 0 < 0 + 6
  • 0 < 6

This statement is true because 0 is smaller than 6. This means that the side that has the coordinate of (0,0) will be shaded in. This will also have a broken line because it is not equal to.

Now when we change the sign to greater to (>) it will flip because 0 would not be greater than 6


  • y > \frac{1}{2}x + 6
  •  0 > \frac{1}{2}(0) + 6
  • 0 > 0 + 6
  • 0 > 6
  • FALSE STATEMENT

If the sign was \underline {>} or \underline {<} the line would be solid.

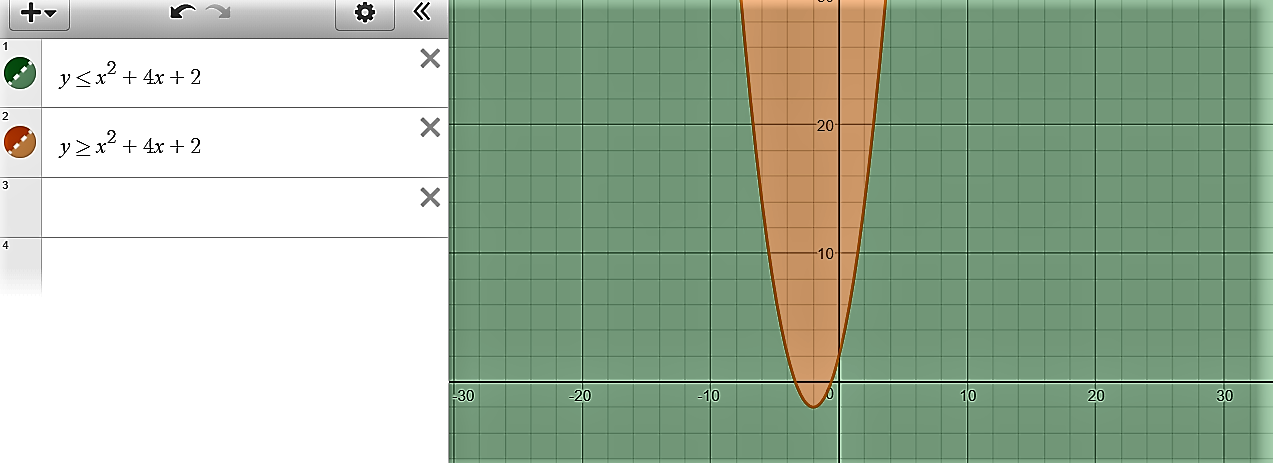
You can also graph a parabola

example: y = x^2 + 4x + 2

Step one: Graph the parabola by putting it into standard form.

  • y = x^2 + 4x + 2
  • y =\underbrace{x^2 + 4x + 4} - 4 + 2
  • y = (x + 2)^2 -4 + 2
  • y = (x + 2)^2 -2

Graph it from here.

Step two: chose a point on the graph and make a true statement.

  • y \underline{<} x^2+4x+2
  • 0 \underline{<} 0 + 0 +2
  • 0 \underline{<} 2
  • TRUE STATEMENT, 0 is smaller than two

The side with (0,0) as a coordinate will be shaded in and the line will be solid because it is equal to.

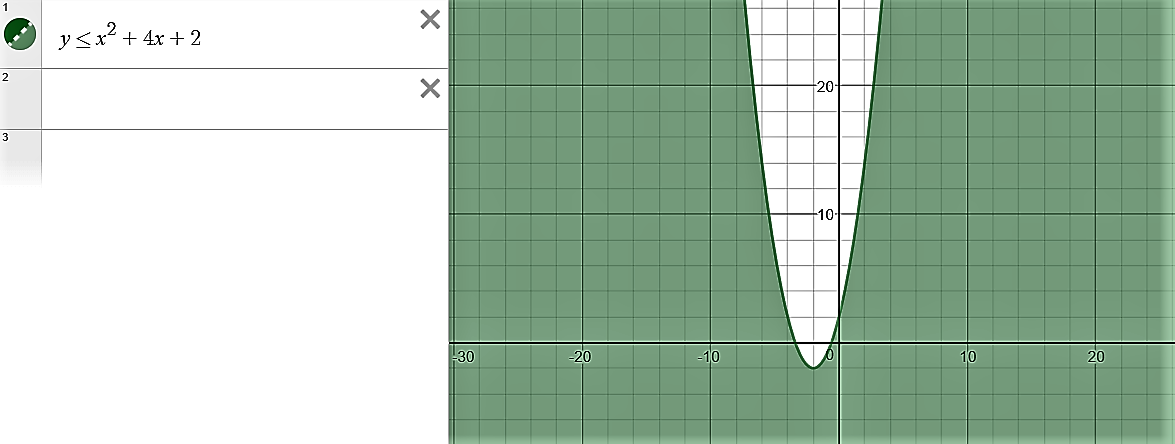
Now if the sign was change the inside of the parabola would be shaded in.

This is how to graph inequalities with linear equations as well as quadratic equations.
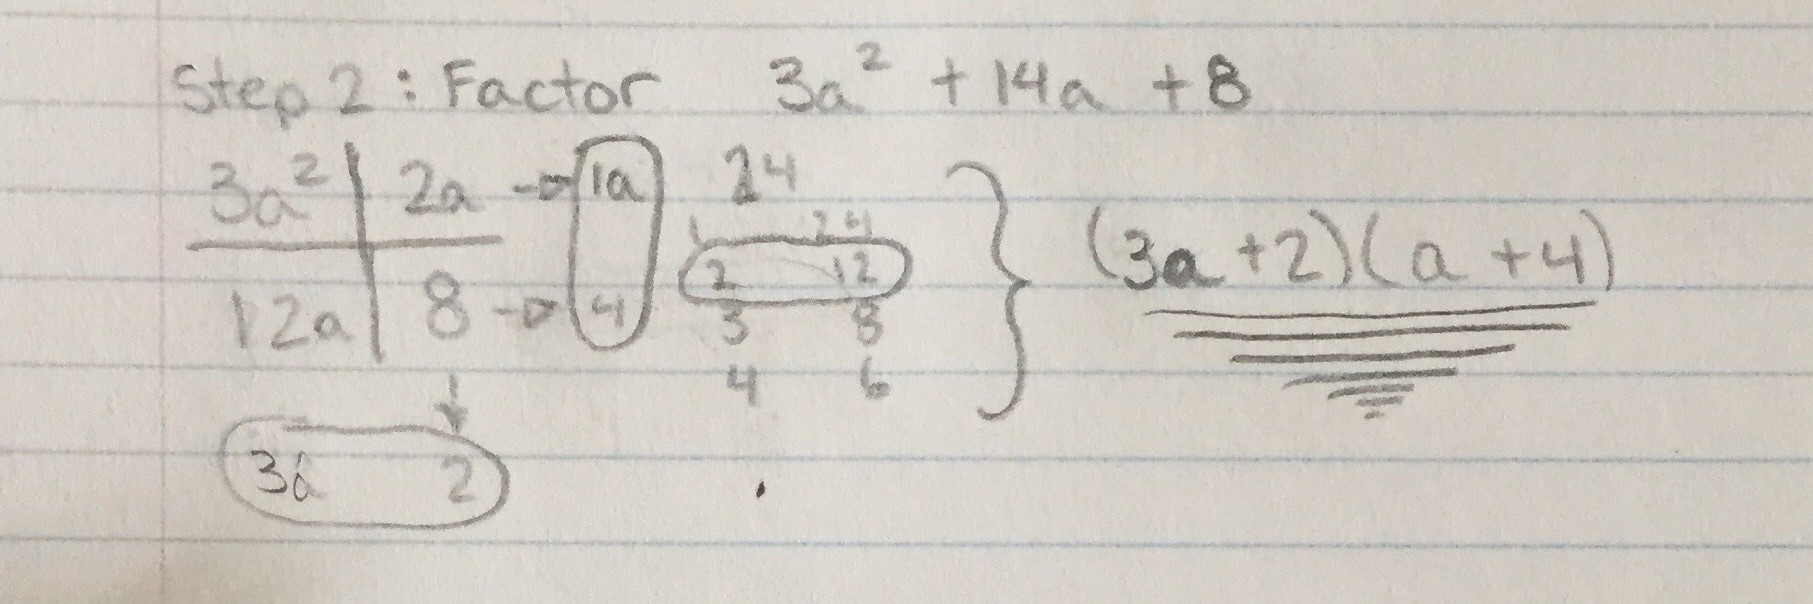
Pre Calculus 11 Week 10: Reviewing Factoring with Substitution

Last week in Pre Calculus 11 we mostly reviewed for our midterm exam. As I was studying I came across a few things that I totally forgot about. Things that would help make my math life easier, like how to use substitution when factoring. This is helpful because it is simple, faster, and not as messy as factoring without this trick. I will quickly review how to do this.

Example: 3(2x-1)^2 + 14(2x-1) + 8

Step 1: Substitute (2x-1) with a variable.

\star Notice that there are two (2x-1), therefore you can use the same variable for both terms.

  • 3a^2 + 14a + 8

Step 2: Factor3a^2 + 14a + 8

  • (3a + 2) (a + 4)

Step 3: Substitute (2x – 1) back into the factored form to replace the variable a.

  • (3a + 2) (a + 4)
  • (3(2x -1) + 2) ((2x-1)+ 4

Step 4: Distribute

  • (3(2x -1) + 2) ((2x-1)+ 4
  • (6x-3 +2)(2x-1+4)

Step 5: Simplify

  • (6x-3 +2)(2x-1+4)
  • (6x-1)(2x+3)

FINAL ANSWER

(6x-1)(2x+3)

To find the solutions make each factor equal to zero and solve for x:

6x-1=0 –> 6x=1 –> x=\frac{1}{6}

2x + 3=0 –>2x=-3 –> x =- \frac{3}{2}

This is how to use substitution while factoring. This is a very helpful and quick way to factor difficult looking equations.