This week we learned about the difference between reciprocal function graph and absolute value graphs and how to graph each one.
For absolute value graphs it is graphs that reflect off the x axis/intercepts of the line to create a reflection of the parent function as in an absolute value equation we can’t get a negative, so in the graph we can’t go into the negative zone.
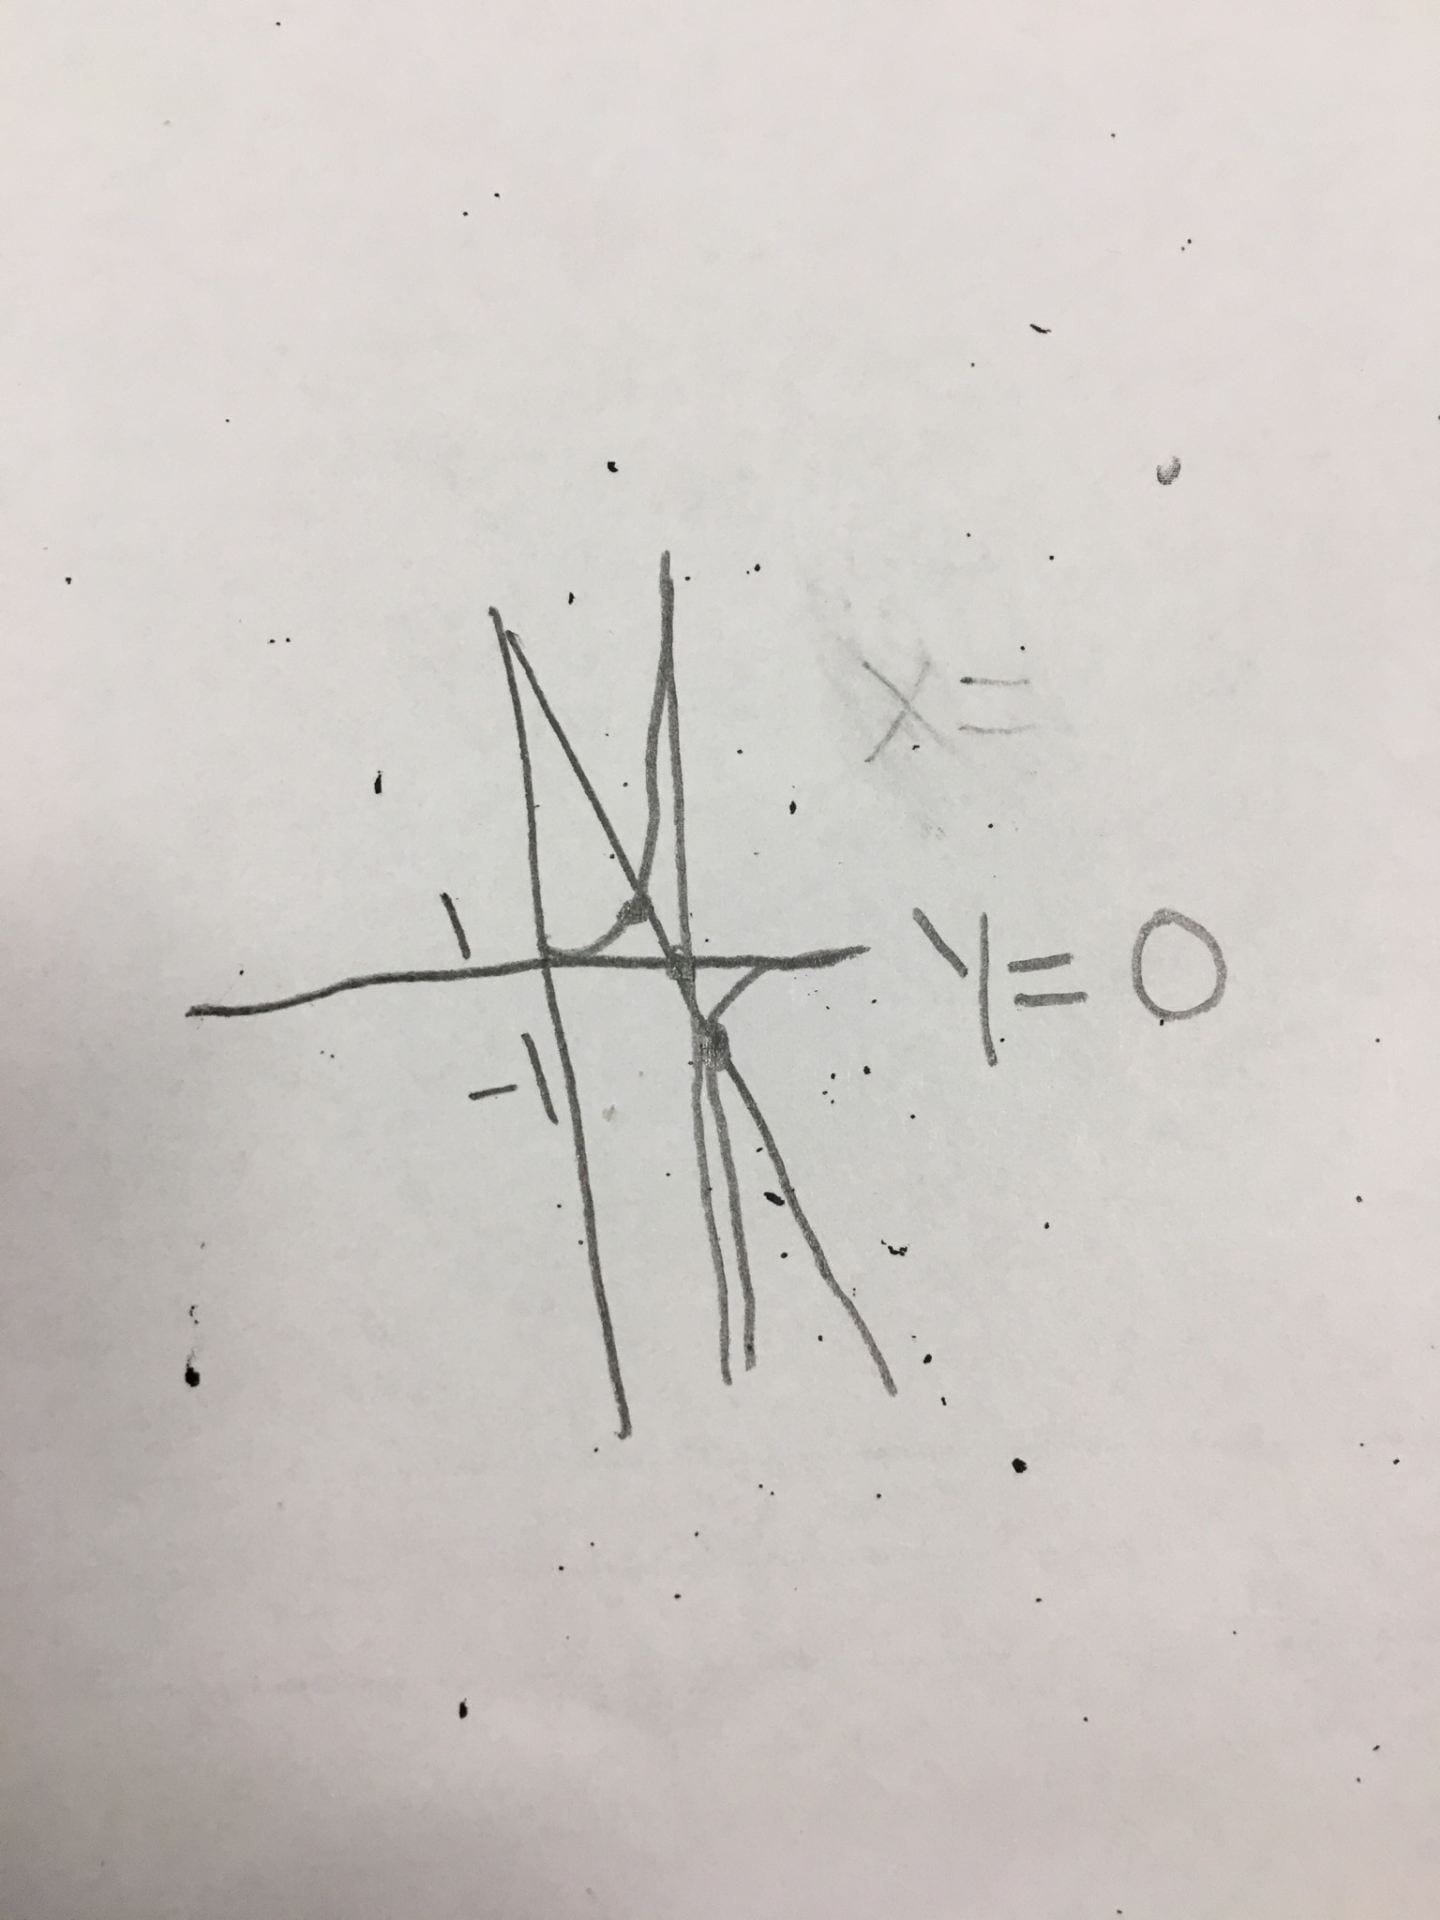
In a reciprocal function graph we focus on the invariant points in the parent function to create a new line that avoids the asymptotes on the x and y axis, y is usually 0 so it’s usually the x axis that we want to focus on. We use the middle of the invariant points to create the x asymptote.
Example of absolute value graph

Example of reciprocal function graph