Part I: Preparation of a standard absorption curve for FeSCN+2
| Standard |
0.20M Fe(NO3)3 |
0.0020 M KSCN |
0.100M HNO3 |
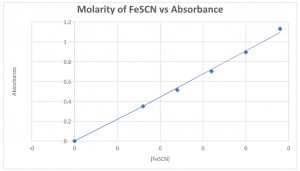
[FeSCN+2] |
Absorbance |
| A
|
10.0 mL |
0.0 mL |
15.0 mL |
0 |
0 |
| B
|
10.0 mL |
1.0 mL |
14.0 mL |
0.00008 |
0.350 |
| C
|
10.0 mL |
1.5 mL |
13.5 mL |
0.00012 |
0.514 |
| D
|
10.0 mL |
2.0 mL |
13.0 mL |
0.00016 |
0.702 |
| E
|
10.0 mL |
2.5 mL |
12.5 mL |
0.00020 |
0.895 |
| F
|
10.0 mL |
3.0 mL |
12.0 mL |
0.00024 |
1.130 |
EQUATION: y=4529x R2__0.9957_____
Part 2: Measuring Equilibrium
| Test Solution |
0.0020 M Fe(NO3)3 |
0.0020 M
KSCN |
0.10 M
HNO3 |
Initial [Fe+3] |
Initial [SCN–] |
Absorbance |
Equilibrium
[FeSCN+2]* |
| I
|
5.0 mL |
0 |
5.0 mL |
0.001 |
0 |
0 |
0 |
| II
|
5.0 mL |
1.0 mL |
4.0 mL |
0.001 |
0.0002 |
0.162 |
0.000036 |
| III
|
5.0 mL |
2.0 mL |
3.0 mL |
0.001 |
0.0004 |
0331 |
0.000073 |
| IV
|
5.0 mL |
3.0 mL |
2.0 mL |
0.001 |
0.0006 |
0.508 |
0.000112 |
| V
|
5.0 mL |
4.0 mL |
1.0 mL |
0.001 |
0.0008 |
0.612 |
0.000135 |
| VI
|
5.0 mL |
5.0 mL |
0.0 mL |
0.001 |
0.0010 |
0.796 |
0.000176 |
* To be determined from the standard graph equation.
ANALYSIS:
- Use your graph equation to calculate the equilibrium concentrations of FeSCN+2.
- Prepare and ICE chart for each test solution (II – VI) and calculate the value of Keq for each of your 5 tests solutions.
ICE CHART II
| Test Solution
Keq =227.7 |
Fe3+ + SCN– ⇄ FeSCN2+ |
| I
|
0.001 |
0.0002 |
0 |
| C
|
-0.000036 |
-0.000036 |
0.000036 |
| E
|
0.000964 |
0.000164 |
0.000036 |
ICE CHART III
| Test Solution
Keq =240.8 |
Fe3+ + SCN– ⇄ FeSCN2+ |
| I
|
0.001 |
0.0004 |
0 |
| C
|
-0.000073 |
-0.000073 |
0.000073 |
| E
|
0.000927 |
0.000327 |
0.000073 |
ICE CHART IV
| Test Solution
Keq =258.5 |
Fe3+ + SCN– ⇄ FeSCN2+ |
| I
|
0.001 |
0.0006 |
0 |
| C
|
-0.000112 |
-0.000112 |
0.000112 |
| E
|
0.000888 |
0.000488 |
0.000112 |
ICE CHART V
| Test Solution
Keq =234.7 |
Fe3+ + SCN– ⇄ FeSCN2+ |
| I
|
0.001 |
0.0008 |
0 |
| C
|
-0.000135 |
-0.000135 |
0.000135 |
| E
|
0.000865 |
0.000665 |
0.000135 |
ICE CHART VI
| Test Solution
Keq =259.2 |
Fe3+ + SCN– ⇄ FeSCN2+ |
| I
|
0.001 |
0.001 |
0 |
| C
|
-0.000176 |
-0.000176 |
0.000176 |
| E
|
0.000824 |
0.000824 |
0.000176 |
CONCLUSION AND EVALUATION:
- Comment on your Keq values. Do your results convince you that Keq is a constant value regardless of the initial concentrations of the reactants? Why or why not?
Yes. Although there is some difference in the Keq, they are close enough to assume that equilibrium concentration does not affect the Keq.
- Calculate the average value of Keq from your five trials. The actual value of Keq for this reaction at 25oC is reported as 280. Calculate (should you use all of your values?) the percent difference of your average value from the reported value:
Avg Keq=244.2
% difference = (|experimental value – reported value|) x 100%
Reported value
% difference = (|244.2-280|) x 100 = 12.8%
280