In Math 9, I have learned about the following:
- Patterns
- Plotting patterns on coordinate axes
- Horizontal and vertical lines on an axis
Patterns
This is a visual pattern.
 We can see that the pattern starts at 1 red square, and increases by four every figure. With that knowledge, we can extend it.
 This chart corresponds to each figure and how many squares they have.
| X | Y |
| 1 | 1 |
| 2 | 5 |
| 3 | 9 |
| 4 | 13 |
Here, the X column corresponds to the figure number, and Y to the number of squares in a respective figure. Now, the X and Y are important for writing the pattern rule. To figure out the pattern rule, you should observe each number and think of different equations that could result with the Y value. For example, 4 multiplied by 1 equals 4 and 4 minus 3 is 1. So if we tried that with 2, so 4 multiplied by 2 equals 8, minus 3 is 5. We now have our rule.
y=4x-3
Now, the rule is useful for finding a missing Y value in a chart. An example:
| X | Y |
| 1 | 1 |
| 2 | 5 |
| 3 | 9 |
| 4 | 13 |
| 5 | ? |
| 6 | 21 |
We know what the rule is, so if we make x 5 in y=4x-3, we get y=4
4 multiplied by 5 is 20, minus 3 is 17.
We now know that 5 corresponds to 17 in the chart. But there are other ways to figure out the missing value. For example, we know that 4 is added each time, so if we add 4 to the last known Y value, 13, we get 17.
If you didn’t know how much is added each time, and you only have two known values with a larger gap, like this…
| X | Y |
| 6 | 21 |
| 7 | ? |
| 8 | ? |
| 9 | ? |
| 10 | 37 |
Here is a trick to figure out how much is added each time. The difference between 21 and 37 is 16. 16 divided by 4, which is the amount of missing values plus the one we know at the other end of the missing values, is 4. 4 is the amount that we need to add by.
| X | Y |
| 6 | 21 |
| 7 | 25 |
| 8 | 29 |
| 9 | 33 |
| 10 | 37 |
If you need to fill a t-chart using an equation alone, you can simply plug in X values for each figure to get your Y values.
Plotting on coordinate axes
Coordinate axes can be used as a way to visualize numerical patterns. This is an example of a blank coordinate axis.
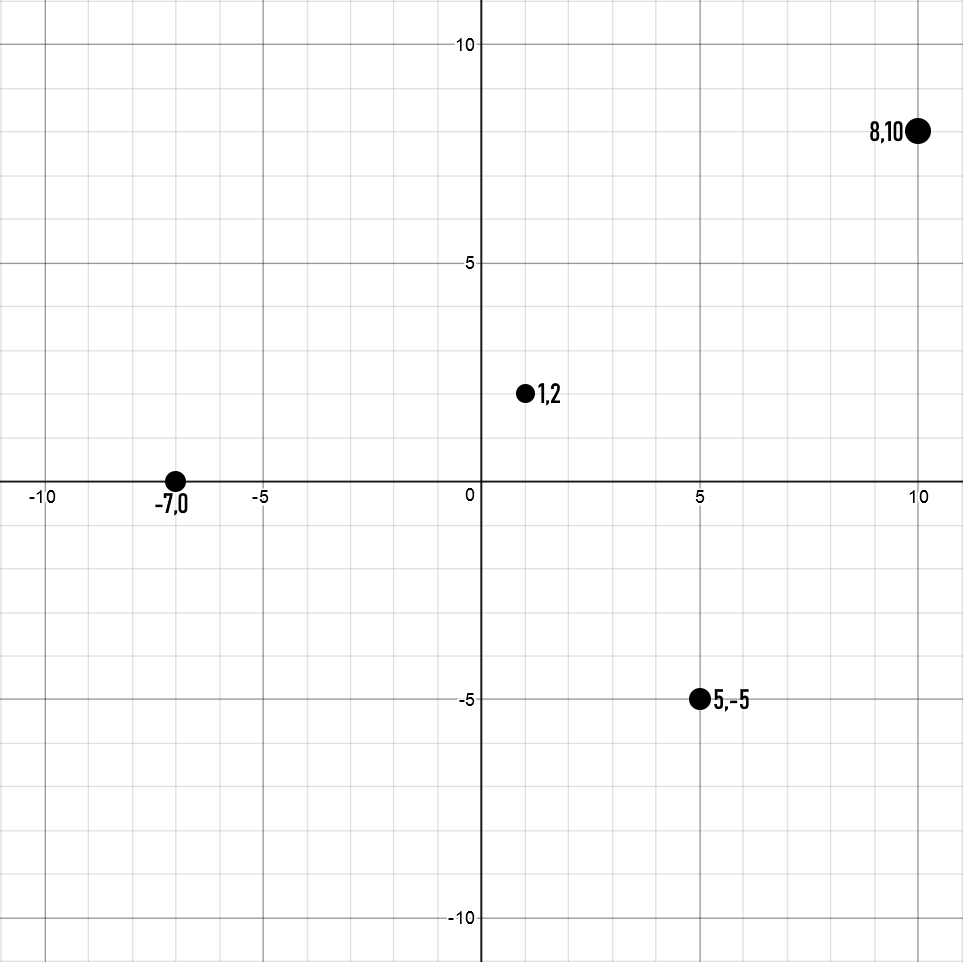
 On a coordinate axis, X is represented by the horizontal axis and Y by the vertical axis. The further right and up you go, the larger X and Y gets, but the further left and down you go, the smaller it gets. Here is an example of some points on a coordinate axis, labelled.
 Plotting a pattern requires translating the X and Y values on to their respective coordinates. I’ll use y=2x+6 as an example. Here is the chart for the equation and the coordinate axis.

You can see that each point corresponds to an X an Y value. The line shown indicates that these are valid plot points. You can see that negative points have been plotted as well, which one can do if the pattern has too much distance between points to fit on a chart going one way.
For rules with fractions or decimals, any fractions should be converted to decimals and point locations approximated on the axis. For example, here is y=2.5+2.25 on an axis.
 Horizontal and vertical lines on an axis
Another post I made on this topic
Horizontal and vertical lines result from having an equation as simple as y=3 or x=11. Equations that determine Y values are horizontal, and equations that determine X values are vertical. Here is a visual of y=6 and x=7.
 As long as there are no operations in an equation, it will be straight on a graph.