Month: December 2017
Wonky Initials- Math 10
Week 15- Math 10
A question that I had some trouble on this week was this one:
Write the equation, in general form, of a line perpendicular to 3x-2y+5=0 and with the same y-intercept as 3x–y+18=0.
From the work below, we know that the y-intercept is 18.
In class, we learned that the slope of a line that is perpendicular will be the reciprocal and the opposite symbol- negative or positive. From the given formula, we can change it to slope-intercept form and find the slope. Then, we will reciprocate it and change it to a negative or a positive.
Now that we know the y-intercept and the slope, we can write a formula in slope-intercept form with this information.
From the slope-intercept form, all we need to do is to rearrange to make it equal to 0 and that will be the final answer.
CC Self-Assessment
This is the self-assessment from my novel study project from Une bouteille dans la mer de Gaza
Week 14- Math 10
On Friday, we started slopes. I remember doing a little bit of this in grade 8 and 9 but all I remember were slopes being positive (or only the positive ones) so I assumed that all slopes were positive. This week, I learned that slopes can be negative.
The concept of negative slopes didn’t wrap around my head easily and I was quite confused about how they could be negative. For me to understand how a slope could be negative, I first figured out that the ones go towards the 2nd quadrant were negative. They usually look like \.

I always count the run first so the run of the two points I chose in the picture below is 3. Then I count the rise and the rise of this is also 3. Since the formula for slope is rise/run it will be written as 3/3 and it will be simplified to 1.
However, you can see that the number for the run seems odd. That’s because it is, how I like to say it, “going to the dark side” because it is going towards the negatives. Since I always count the rise upwards, it will always be positive for me but the run can go left or right. If it goes towards the left, or “to the dark side,” the slope will be negative. So the slope of this graph is not 1 but it is -1.
First-Aid Self Assessment
Week 13- Math 10
From grade 9, we learn that x is our input number and y is our output number. In grade 10, we build on that. This week, I learned two new terms that are very useful for this unit. The first one is domain and the second is range.
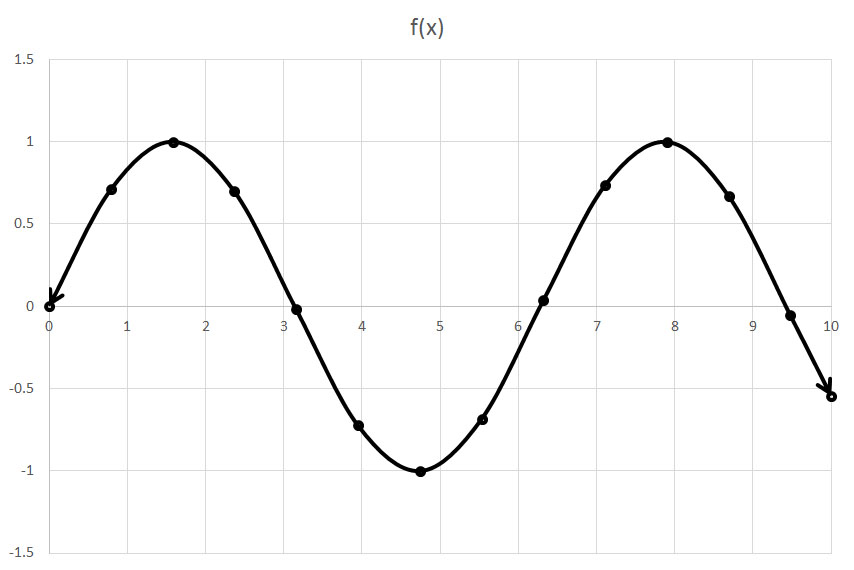
The domain of a graph are all the numbers that can be used for x in an equation. In a graph like this,

You would write your domain like this: D= {0 < x < 10} because the domain is the dots along the x-axis. The curly brackets are used to show that these numbers all have something in common. The less than symbols are to show that x is more than 0 and less and 10 since the dots at the end are open dots meaning the values in between will be more or less than where the dot is. There is also that part here: x ε R, this symbol, ε, means that x is an element of R.
The range in the graph would be the highest and lowest point along the y-axis. So, the range of the graph above would be written like this R= {-1 ≤ y ≤ 1}. For this one, we used the less than symbol because the dots are closed dots.
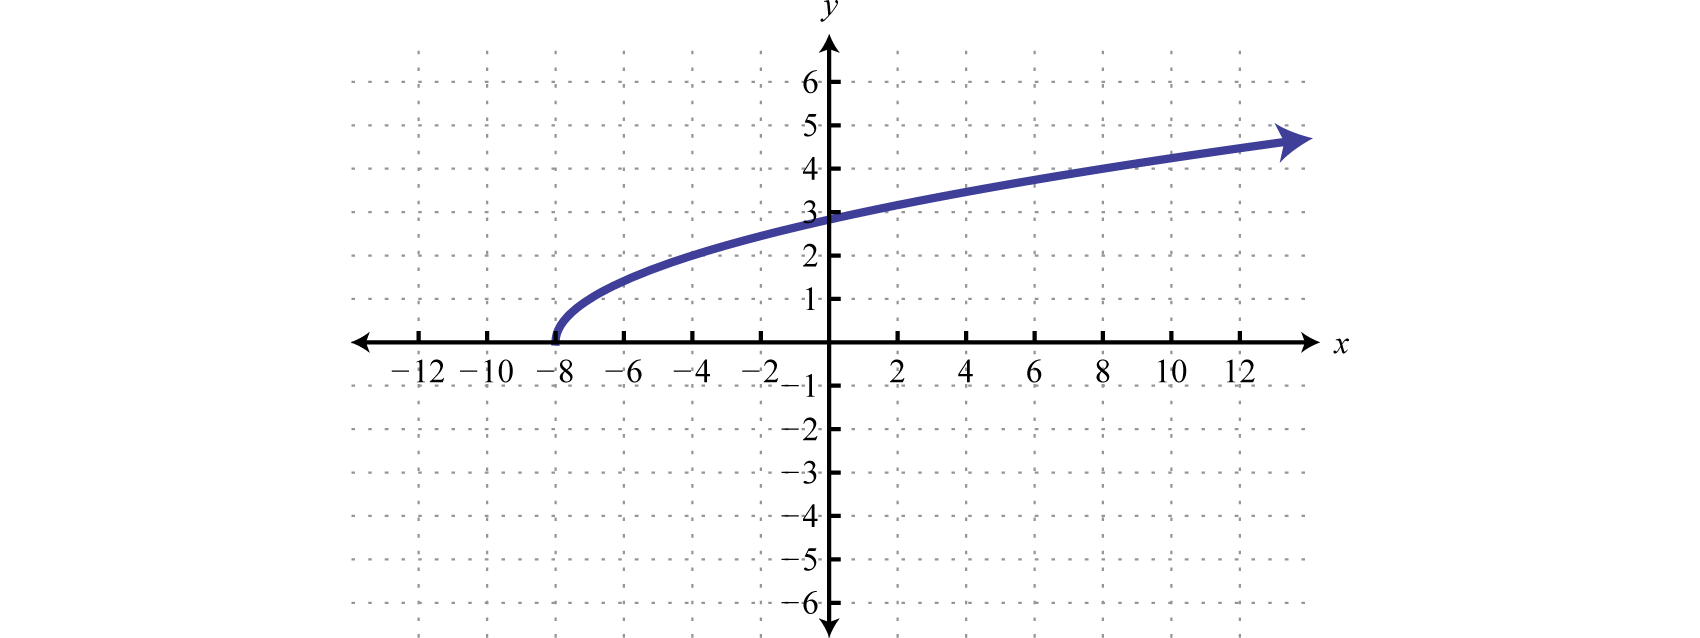
If the graph has arrows, like this one:

You would have to include xεR in the domain and yεR in the range because it is continuous. This symbol, ε, means that x or y is an element of R.


