This week in Precal 11, we learned about graphic quadratic equations. From grade 10, we were taught on how to graph linear equation – which looks like a straight diagonal line, and we follow the equation form called the slope-y intercept form or y = mx + b. In this case for graphing quadratic equations, we would have a “U” shape on the graph called the ‘parabola,’ and this is because we have two solutions since it’s quadratic. Since we are talking about graphing, we would call the quadratic equation as “quadratic function because we are graphing instead of solving. For quadratic functions, its most basic form aka “parent function” is y = 
this is what it looks like on the graph:
y =
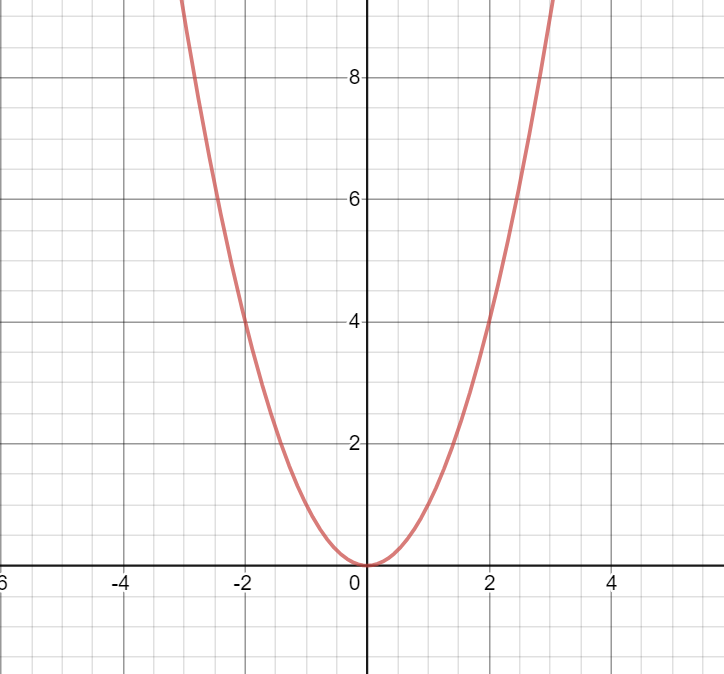
Furthermore, we learned that there’s also a pattern in quadratic equation which is (1, 3, 5).
We also learned about describing quadratic functions in which there are seven characteristics such as:
- Vertex – the ‘starting point’ or corner of the parabola in which we would write it as a coordinate and for the parent function (example from above) its coordinate is (0,0).
- Minimum and maximum point – which is also part of the vertex. We can determine if the vertex is a minimum point if the parabola is pointing upwards meanwhile if it’s at maximum point its parabola would be pointing downwards because the vertex is at the ‘highest peak’.
- Domain – which is the set of all complete possible values of x in order for the function to work nicely.
- Range – which is the set of all complete possible values of y in order for the function to work nicely as well.
- X-intercept – where the point touches the x-axis and for the example above, its x-intercept lies on zero.
- Y-intercept – where the point touches the y-axis and for the example above, its y-intercept lies on zero as well.
- Line of symmetry – this is a line where it divides the parabola that would look very symmetrical like a mirror/reflection. In this case, the line of symmetry is (x = 0).
We also learned about comparing other equations to parent functions in which we learned three different functions such as:
- (y =
- (y =
) – this is a horizontal translation in which the parabola moves side to side. Furthermore, the size is still congruent to the parent function. Keep in mind, the if the value of p is positive and its function is like this:
we would move to the left because the value of p is -10 considering that when we insert it into the equation, we would have two negative and with that, it would turn into a plus sign because the numbers of negatives inside are even.
- (y =
) – this is where the parabola’s size would change; it’s either going to be narrow or wider. We can determine if a parabola is narrow when the a value is further from zero such as 4 because when we follow the pattern (1, 3 , 5) in graphing quadratic equations, we would multiply these patterns by 4 in which the pattern that we would plot on graph will have a big gap and that would result as a stretched/narrow parabola. Meanwhile if the a-value is closer to zero such as 1/2, it would be wider because we when we multiply the pattern (1, 3, 5) by 1/2 it would only go up a little bit and run by 1 time. Furthermore, when the value of a is (-) negative, its parabola would be upside down or becomes a “reflection” of the original form.
Be First to Comment