This week in math we learned the begging steps of graphing a quadratic equation, but before we learned how to do that we learned how to indentify if a function is linear, quadratic, or neither using a table of values. I chose this subject because I like having a visual, such as a table of values, to see what my function would look like. This understanding is important because knowing the difference between a linear equation, which we dealt with in earlier years, and a quadratic equation, which we are dealing with now and will continue to reappear in later math, is a fundemental skill and comprehension to have. For reference, lets look at a linear function on a graph and a quadratic function on a graph.
Linear :

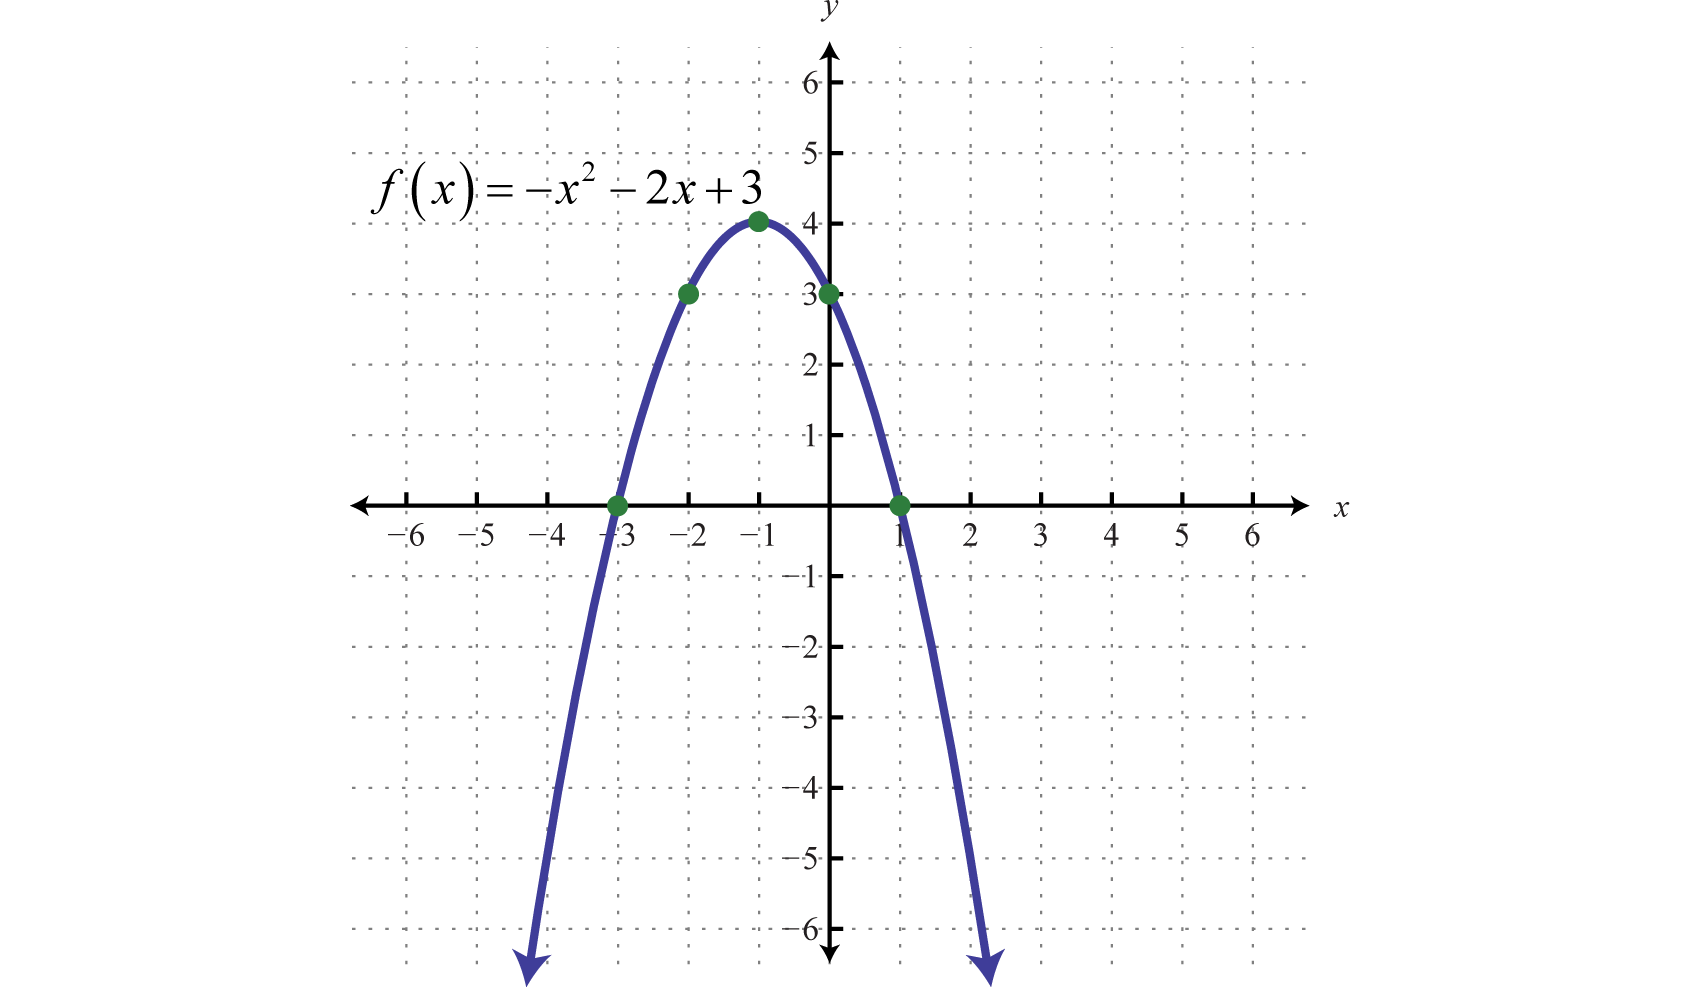
Quadratic :
Example a.)

Step 1. My first step is to observe the pattern of x values in my table of values, notice how they are decreasing by 1. Therefore, the difference between the y values may determine the behaviour of the ordered pairs.
Step 2. Find the difference between the first two terms. -2 – (-3) = 1. Repeat this process to find the first difference. You should get 1, 2, 4, and 8. Notice how the first difference is not constant. This indicates we are NOT evaluating a linear function.
Step 3. We can now find the 2nd difference. Use the values of the first term to find the second difference. The first value is 2-(1) = 1. Repeat this process and get 1, 2 and 4. Notice the second difference is NOT constant. this means that it is NEITHER a linear function or quadratic.
Example b.)

Step 1. Notice that the x values are increasing by 2 units. The difference between the y values may detrmine the behaviours of the ordered pairs.
Step 2. Find the first difference. To get our first value, find the difference between 5 and 0; 0 -(5) = -5. If you continue this process for the rest of the values you get -5,-7,-9,-11. Notice how the first difference is NOT constant meaning that it is not a linear function.
Step 3. Find the second difference. Use the values of the first difference, and find the difference between each value. -7 – (-5) = -2. If you continue this process you get -2, -2, -2. The second difference IS constant meaning it is a quadratic function.
Glossary :
Linear function :a function whose graph is a straight line, that is, a polynomial function of degree zero or one.