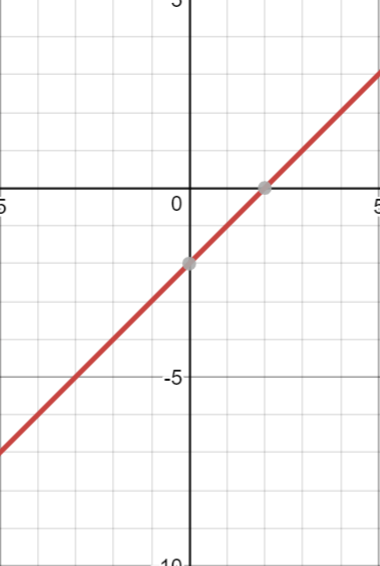
In this week, I learned how to graph the absolute value equations and how to solve it. Assume that there have an absolute value equation: y=|x-2|. The first thing I will going to do is graph the equation without the absolute value bar. (draw the graph of y=x-2 ).
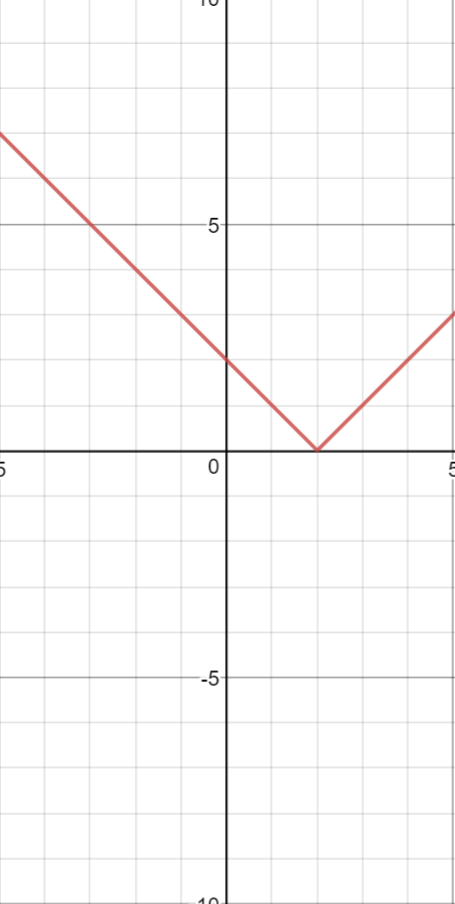
We need make sure the graph of y=|x-2| above the x-axis because the f(x) of absolute value must greater or equal to zero. Reflect the negative part of this graph form the x-intercept, so that we can draw the graph of y=|x-2|.
Solving the absolute value equations:
Step1 : Isolate the absolute value equations.( Make sure let two equations equal to positive and negative the quantity on the other side of the equation. )
Step2 : Solve the equations
Step3 : Check the solutions
Ex: 25=|-2x+9|
(1)25=-2x+9 and -25=-2x+9
(2)25-9=-2x and -25-9=-2x
16=-2x and -34=-2x
x=-8 and x=17
(3)when x=-8, 25=|-2(-8)+9|=|16+9|=|25|
when x=17, 25=|-2(17)+9|=|-34+9|=|-25|
x=-8 and x=17 are the solutions of this absolute value equations.