In class of pre-calculus 11 this week we learned about graphing quadratic inequalities. I’ve simply concluded that using two steps to draw an inequality with two variables. Firstly, draw the parabola and the parabola’s function is to isolate the regions. Take 

^2>-3")
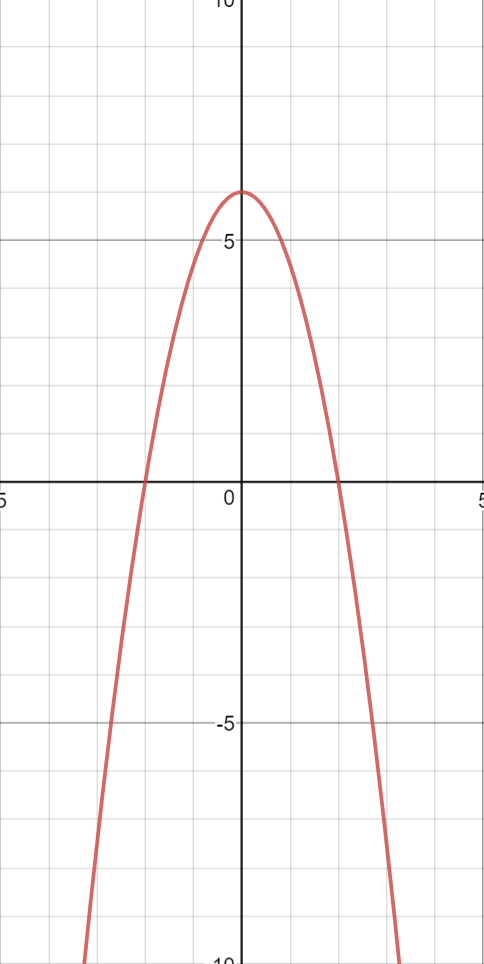
Ex: Graph each quadratic inequalities.
(1)

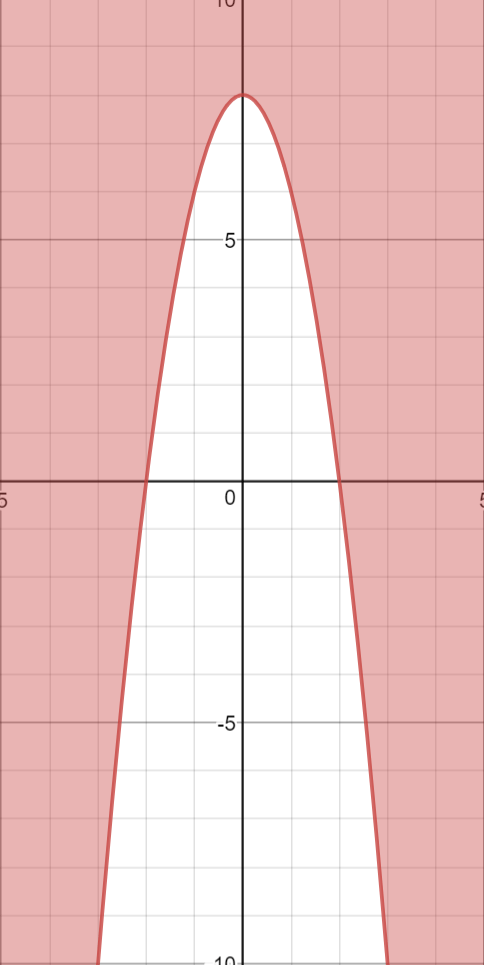

(2)