This week in Pre-Calc 11, we learned how to graph absolute values. These can be applied to both linear and quadratic functions. This task is very easy to complete.
First we will do a linear function.
y= |x+2|
We know that our y-int. is 2, our slope is 1 up, 1 over
First we will graph the function

So we know that it will go past the zero, but we know that the function is an absolute value, which means it can’t go past zero, which means we will have to go back up so it will stay positive.

So for a quadratic it is also very simple.
Our equation will be


Since our vertex is (0,-2) we need to keep the quadratic positive
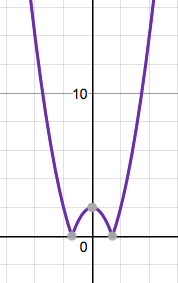
so all we do is move the part that is negative to the positive side.
Week 12 – Graphing Absolute Values