What is a Linear Relation? The words “Linear Relation “, are used to describe the relationship between the input and output of data. This data can be shown through many ways.
One way is a graph, the x-axis runs horizontally, while the y-axis runs vertically. In order to properly place a point on the graph, you must find where the positives and negatives are placed. On the left x-axis, the numbers are negative, on the bottom of the y-axis, the numbers are also negative. On the right side of the x-axis, the numbers are positive, the same as the top half of the y-axis.
You can also plot this in a t-chart. On the left side of the chart, the equivalent of the x-axis, will be the input or step number. As you move to the right side, the same as the y-axis, you get the output, or the result. In order to make a rule, you must find the relations between the two forms of data.

There are 2 types of patterns. One is a decreasing pattern, which is when you get a larger number for the input then you do for the output. Therefore, the line starts in the top left, and gradually goes down diagonally to the bottom right. The values and data in this type gradually get smaller, decreasing.
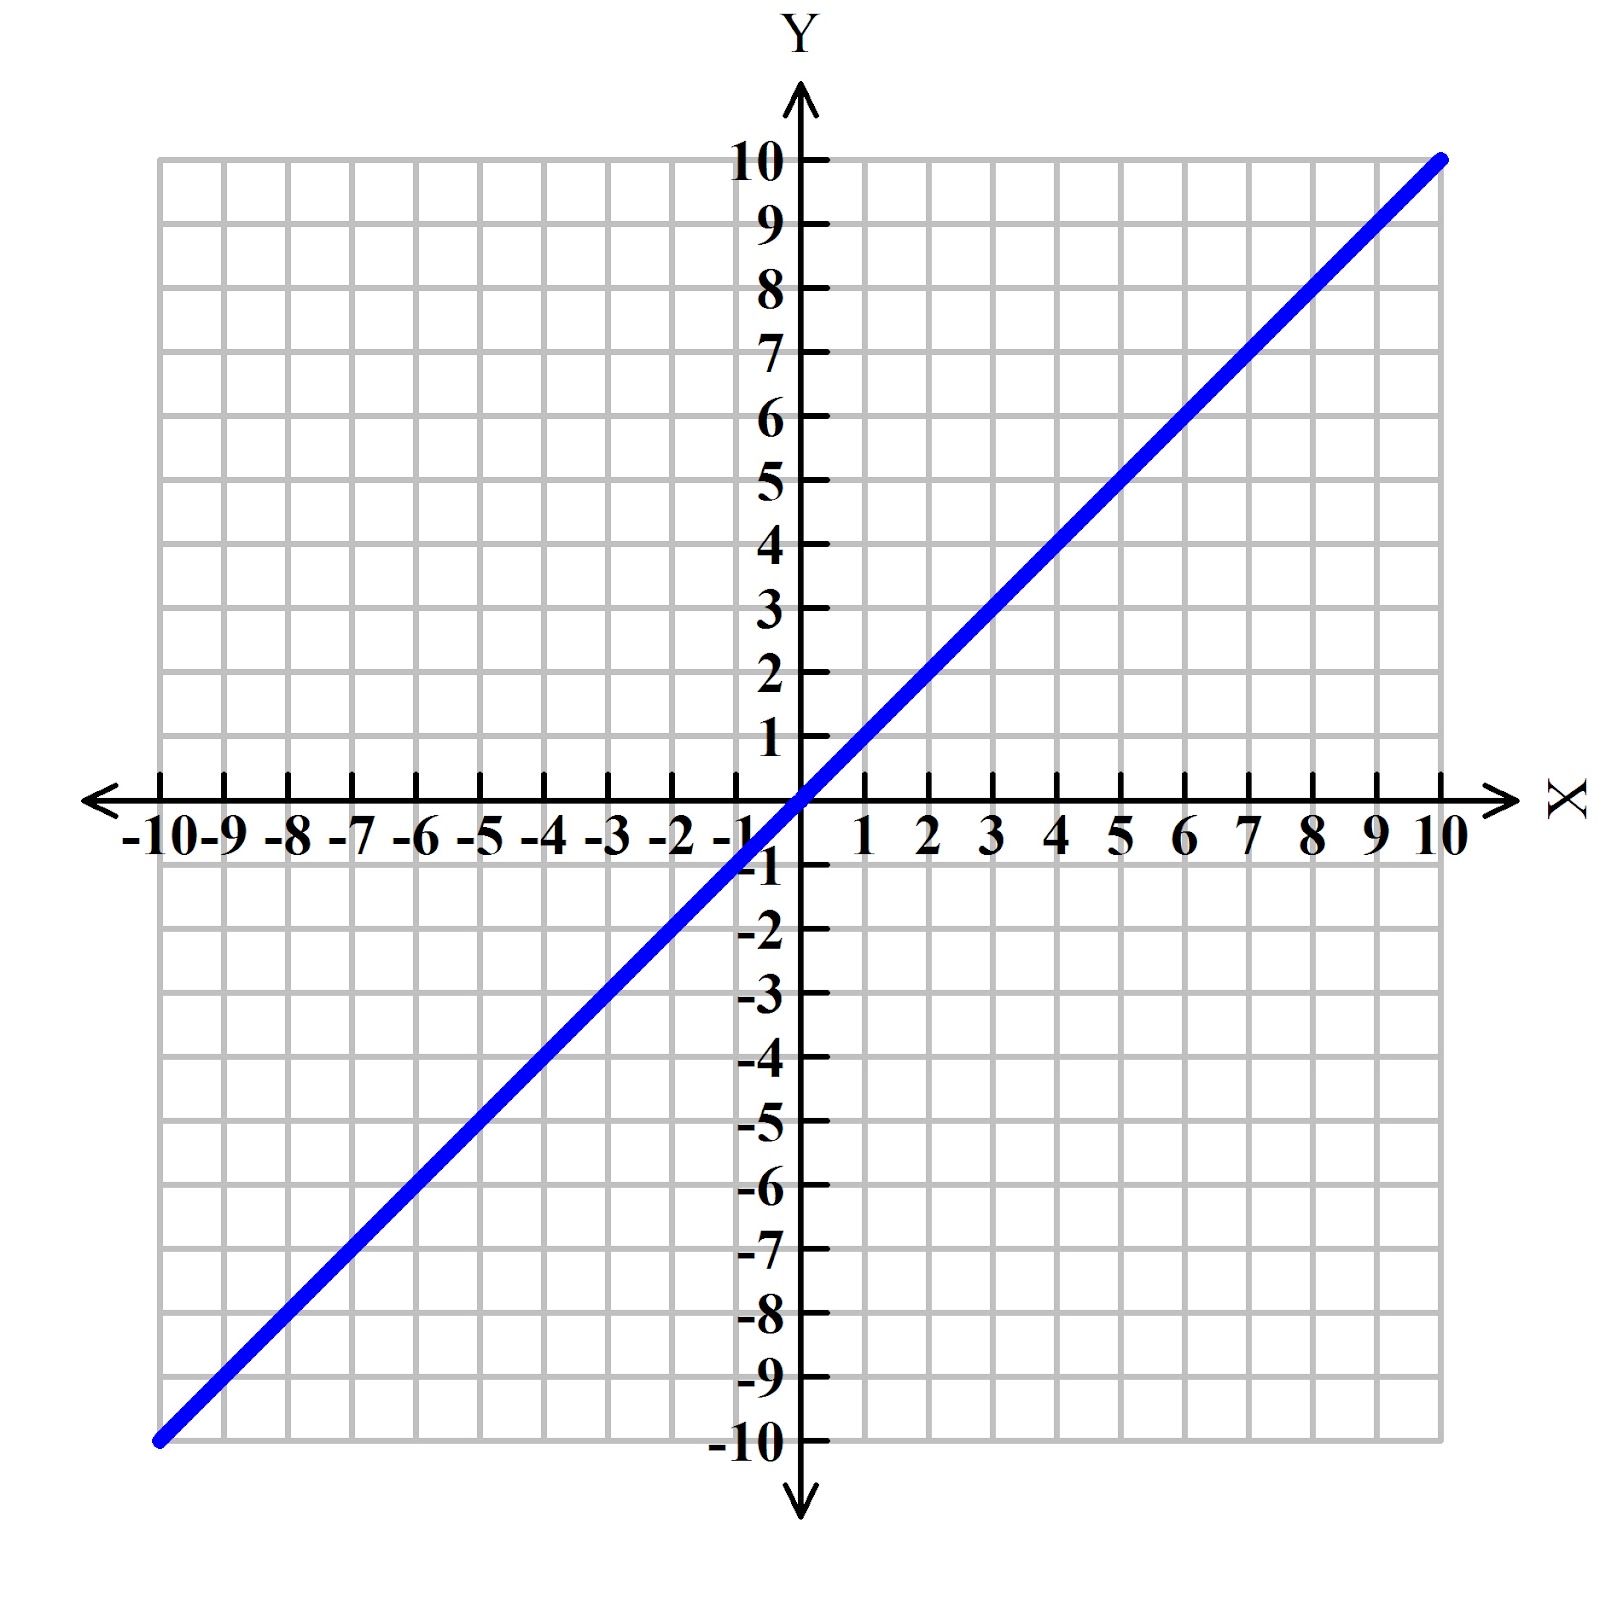
The other type of pattern is increasing. The pattern gradually or suddenly gets larger and larger each time. This pattern below is increasing, as the line starts in the bottom left, and gets larger, and moves to the top right.
If you plot this data on a graph, you will get either a straight or diagonal line. As shown in this graph below, the line is increasing on a horizontal angle.
