Link to article:https://www.newyorker.com/magazine/2018/05/21/prince-harry-meghan-markle-and-royal-romance
I chose this article because the royal wedding of Prince Harry and Meghan Markle is right around the corner, and i wanted more insight about the couple. The author writes in a very descriptive way, giving the reader facts and knowledge about past royal couples and the controversy with certain pairs based on race, religion, ethnicity, etc. I knew of Meghan Markle from the tv show she starred in, Suits, but was not made aware of her attachment to Prince Harry until the past year. The article addressed the past women of the royal family and how race, class, and marital status is becoming less important, replaced with wealth. The pairs love story will be receiving a tv movie called “Harry and Meghan”, which will follow their romantic journey over the years.
This week we learned how to graph quadratic reciprocal functions, and learned some new vocabulary.
quadratic reciprocal functions will look one of three ways when graphed:
- the parent function only touches the x-axis in one spot

- the parent function doesn’t touch the x-axis at all
- the parent function crosses the x-axis in two places

When graphing the parabola, you first find the asymptotes, invariant points, and then the location of the hyperbola.
Asymptotes are located at where the parabola crosses the x-axis. At the x-intercept(s) you can drop a dotted line vertically, and a dotted line horizontally. Depending on how many x-intercepts you have will dictate how many asymptotes you have.
Dotted in red:
Invariant points are located where your parabola meets the points on the y-axis 1 and -1. The parabola can have 0-4 invariant points. These dictate where you’ll draw the hyperbola.
Circled in blue:
Your hyperbola is the graph of the reciprocal of your original equation. For example:  becomes
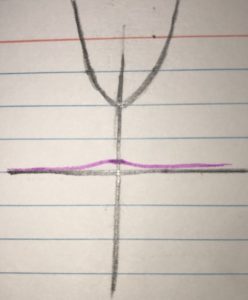
When you graph the hyperbola, there’s no need to graph each individual point. Instead, you can just draw a curved line going through your invariant point and approaching zero.
Colored in purple: