How well do plants grow when watered with dishwashing grey water (with Dawn dish washing soap)?
Part A: Question, Research, and Hypothesis
Research: We found out that plants, especially fruit trees can survive on grey water, so we want to find out if they help the plants grow better than with regular tap water. We found out that you shouldn’t put the grey water on edible parts of the plant because it can harm the humans eating the plants due to the dangerous bacteria and chemicals in the soap and grey water. Some well developed countries don’t trust the use of grey water but countries that suffer droughts that are getting worse as the years pass need to use grey water as they don’t have a large supply of fresh water for plants.
Hypothesis And Reasoning: Our hypothesis is that plants watered with grey water will still grow but not as much as the plants watered with tap water. We think that the bacteria and/or chemicals that we’re exposing the plants to will stunt its growth not letting it reach its full height. Some countries don’t trust grey water, but others are starting to use it, giving us more trust that our plants will still grow if not to their maximum height.
Part B: Plan
Investigation Plan: We will start by getting all our supplies and then by setting up our workspace. On the first day we will water half of our plants with tap water and half of our plants with grey water. We will see if there are any immediate effects. Every couple of days, we will check our plants and take a picture to keep track of our data. On every Monday, Wednesday, and Friday, we will water our plants. On the final day we will check our data and our plants to see if there are any significant differences between the tap water plants and the grey water plants.
Collection Of Data Materials: We will be using two materials to collect our data. The two materials are a camera on an iPad to keep track of the visual changes, and a word document to keep a small journal on day-to-day changes of the plants. These will help us in the end to come to a conclusion on whether the plants watered with grey water were affected at all.
Safety Issues And Risks: There is little to no risk in this experiment. The worst-case scenario is either getting a little dirty, or soap in your eyes; both not life-threatening safety issues.
Ethical, Cultural, And Environmental Issues: As far as what we are doing, there should be no issues, in fact some cultures would probably think its good what we are doing. Our experiment can help people that live in places that don’t have as good access to water as we do. They can look at the results of our experiment or do it for themselves to see if they can use the same water that they washed their dishes with for their plants. As for the First Nations, we can see no way that we are creating any issues with them by conducting this experiment.
Part C: Data
Plant Data Journals
Sep. 24th 2019:
The (TYPE OF PLANT) are in the classroom today with their first water. All look very similar and I would not be able to tell them apart.
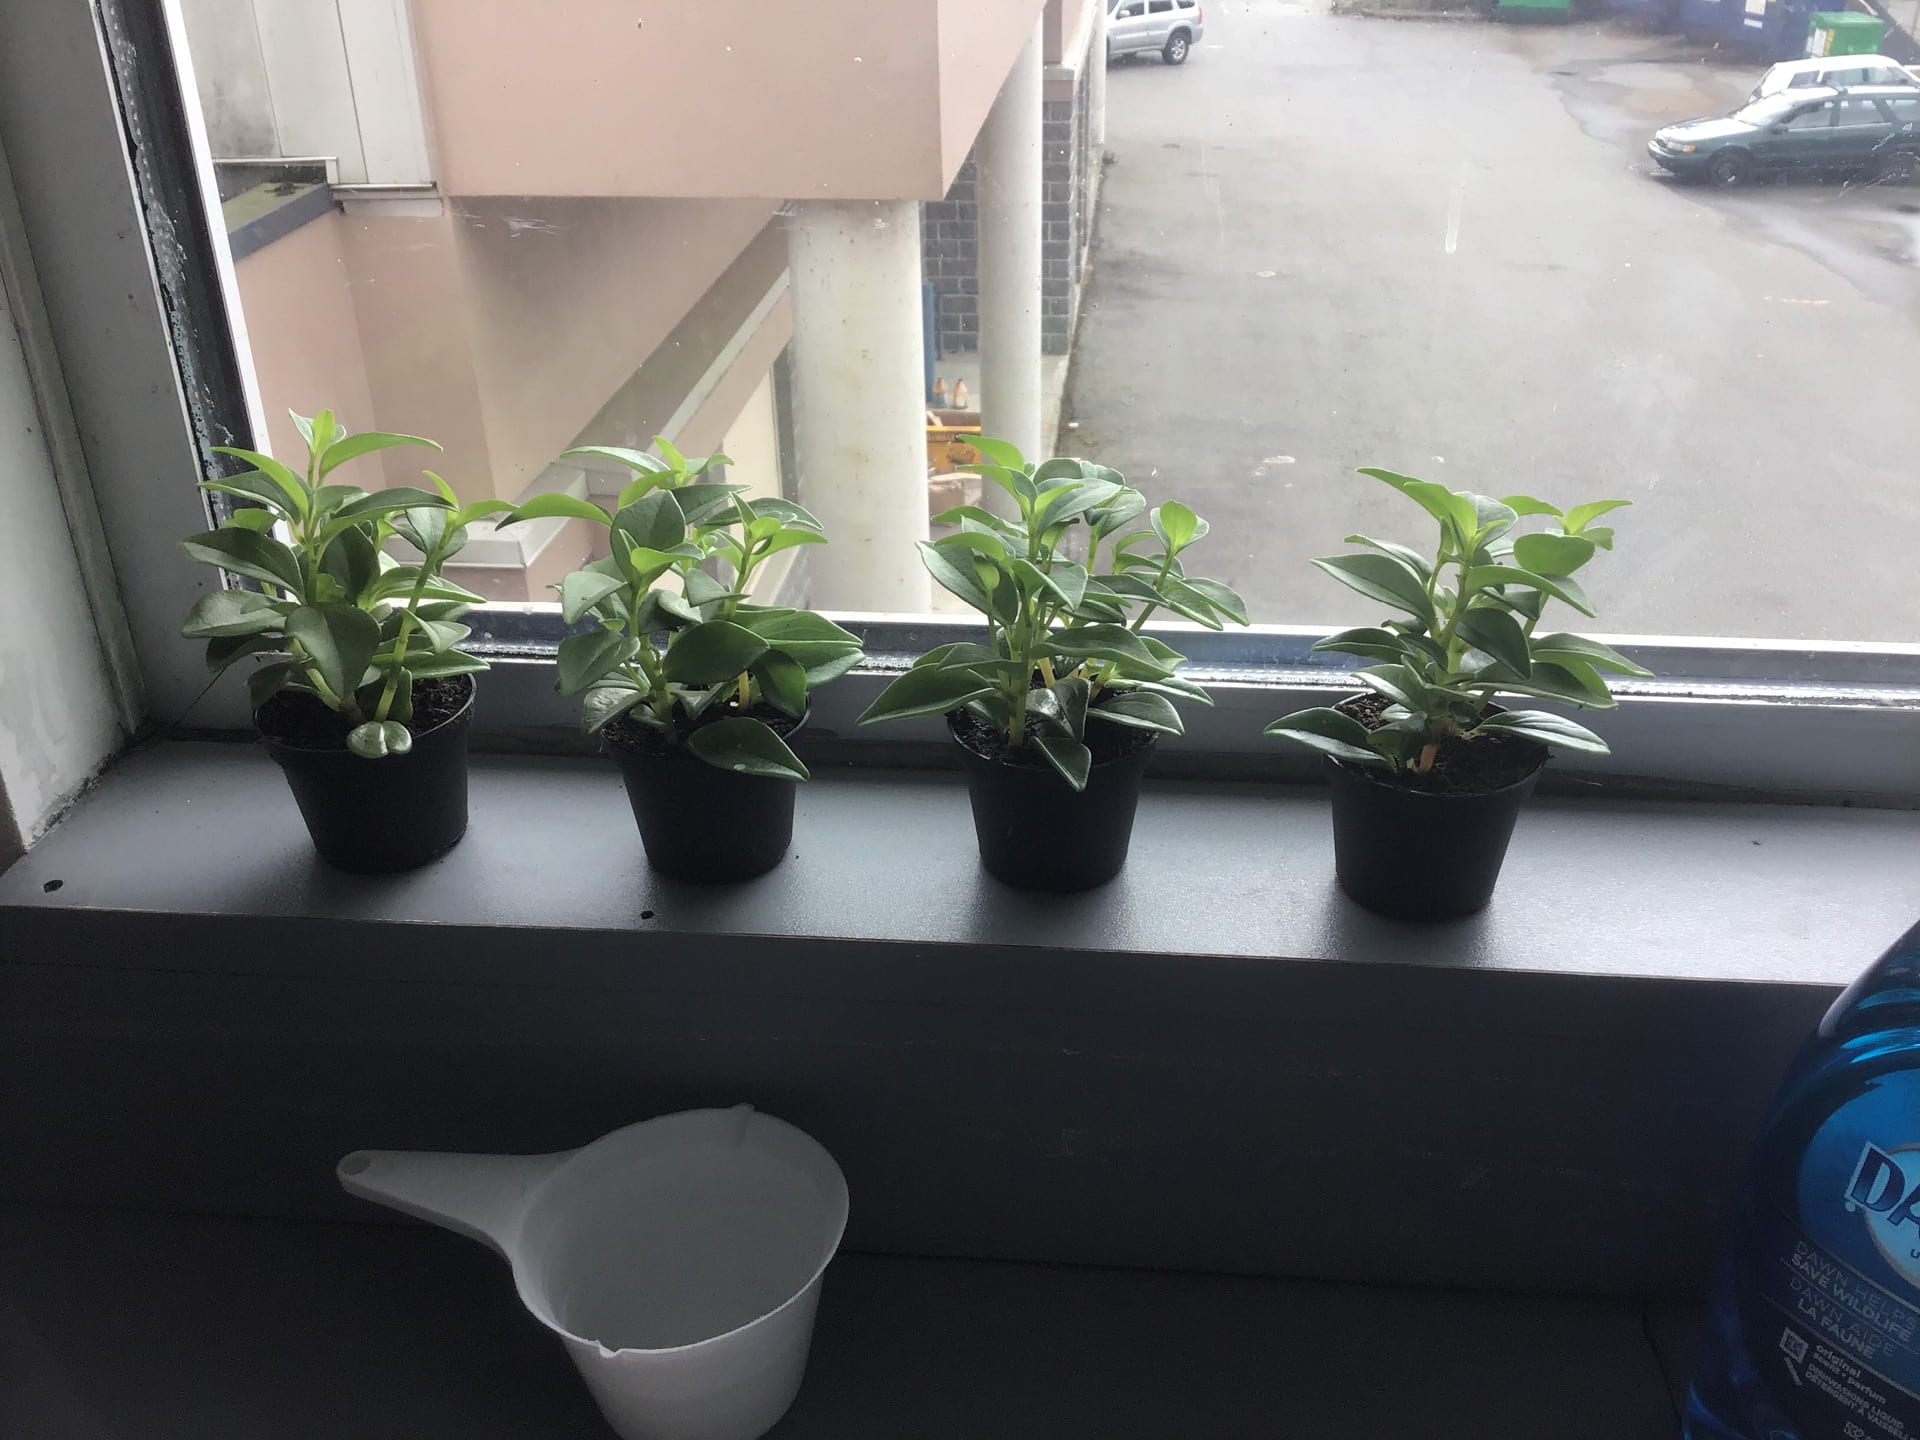
Sep. 25th 2019:
After one day there is still no change which is as expected.

Sep. 27th 2019:
Another two days and still no change. All four plants, both the two tap water and the two grey water are looking healthy.

October 2nd 2019:
Finally we are starting to see a little change. The two grey water plants are starting to look slightly more dry despite the fact that we water both equally.

October 7th 2019:
Almost another week later the differences between the two are becoming more recognizable. The plants watered by tap water seem to have slightly richer colours in both leaves and stem.
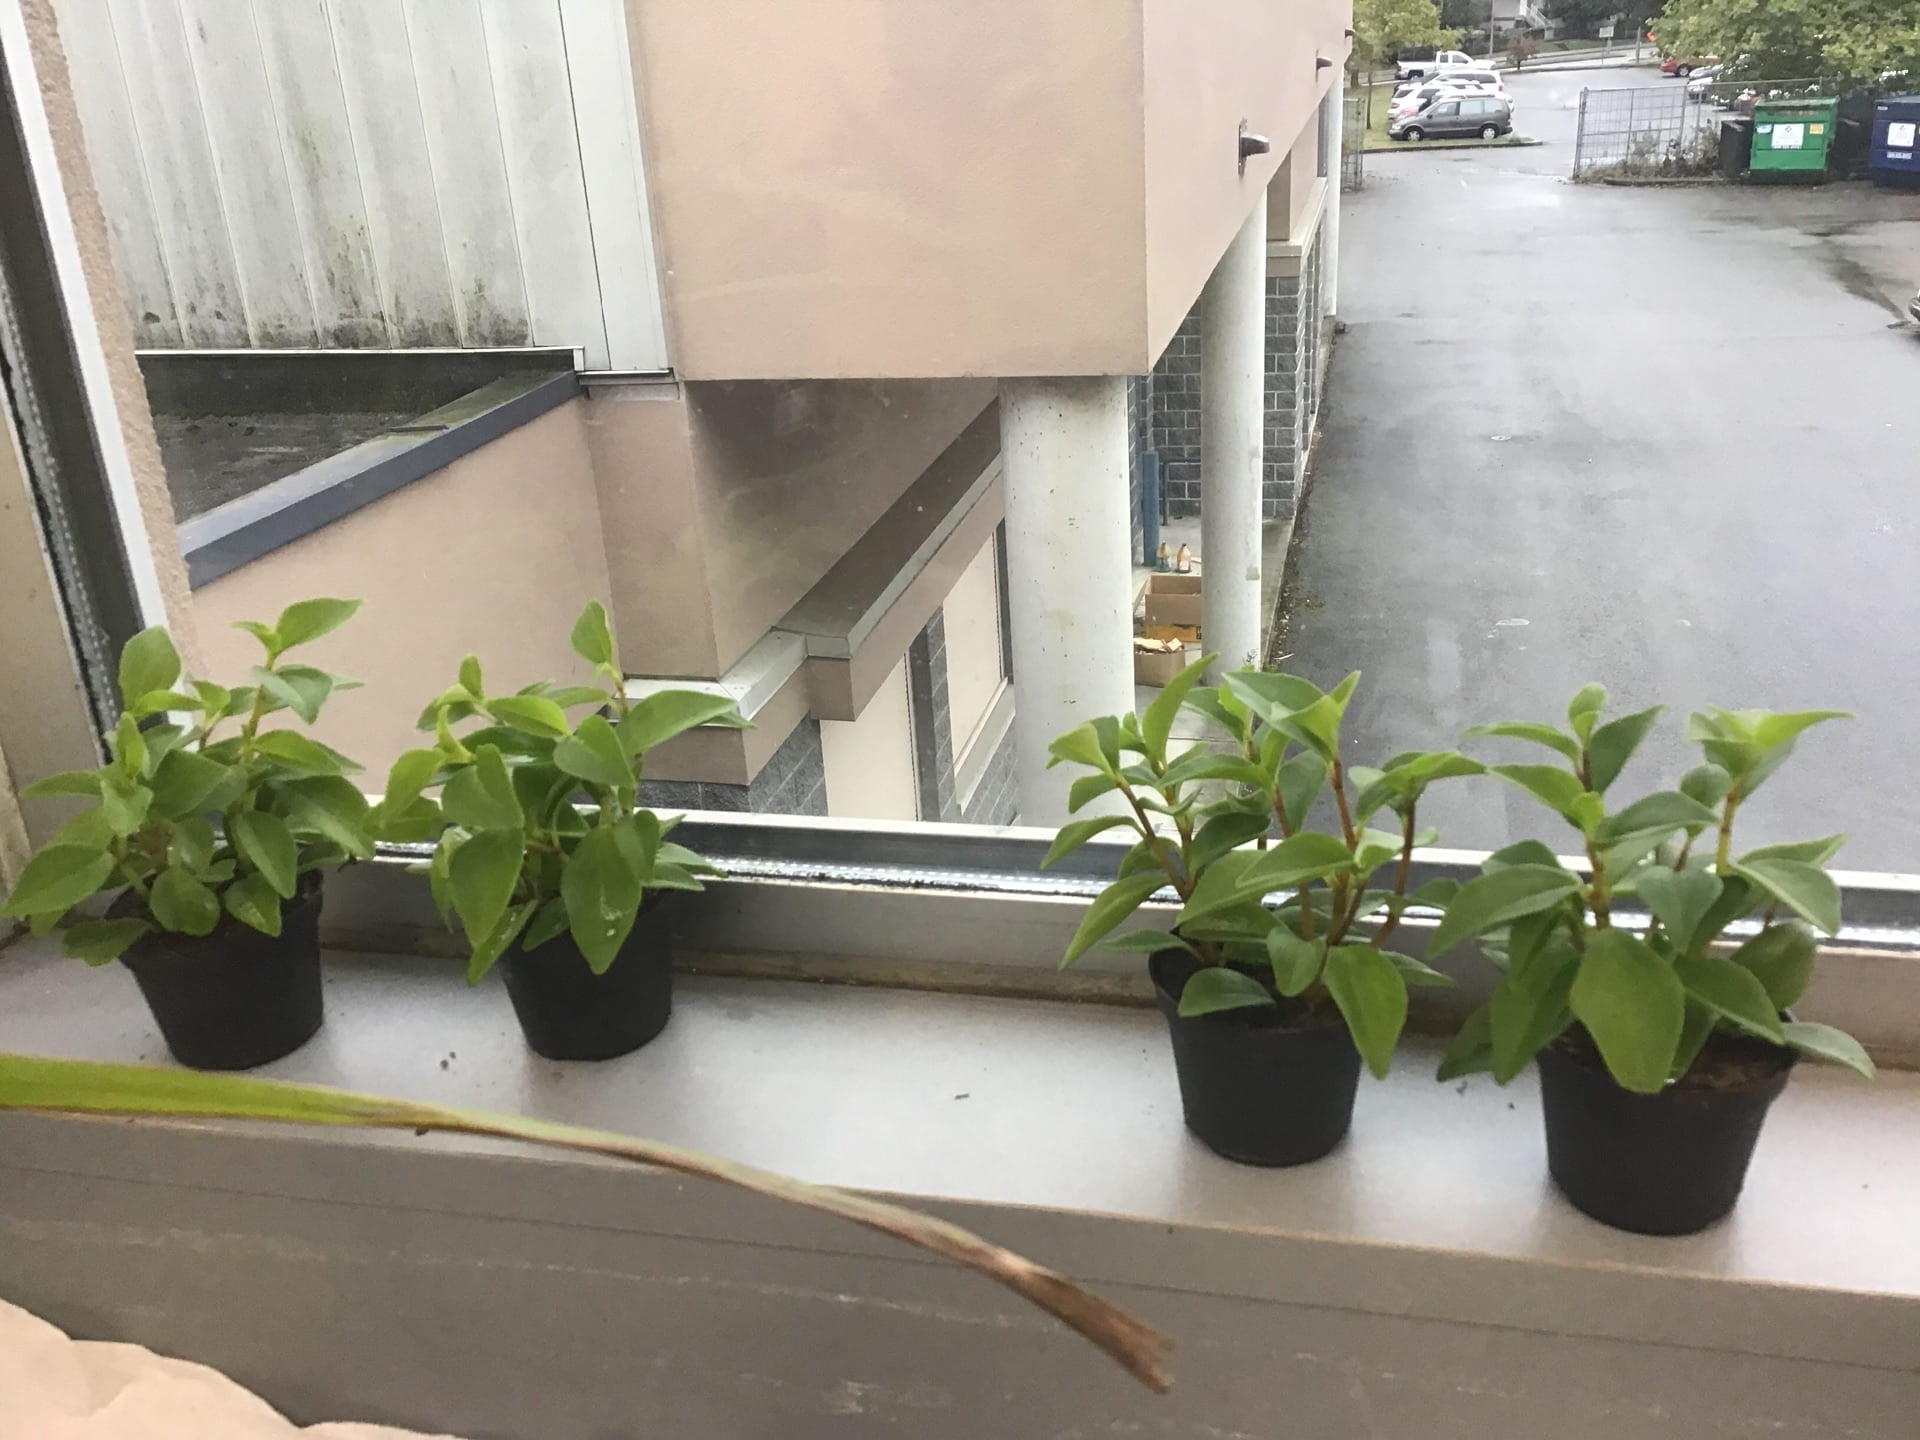
October 11th 2019:
The plants watered by grey water are just becoming more noticeable by how dry they are looking. The grey water plants stems look lighter and not quite so rich in colour.

October 15th 2019:
Our last day of watering. The tap watered plants look healthier in stems and leaves than the grey water plants. Even the height is slightly greater.
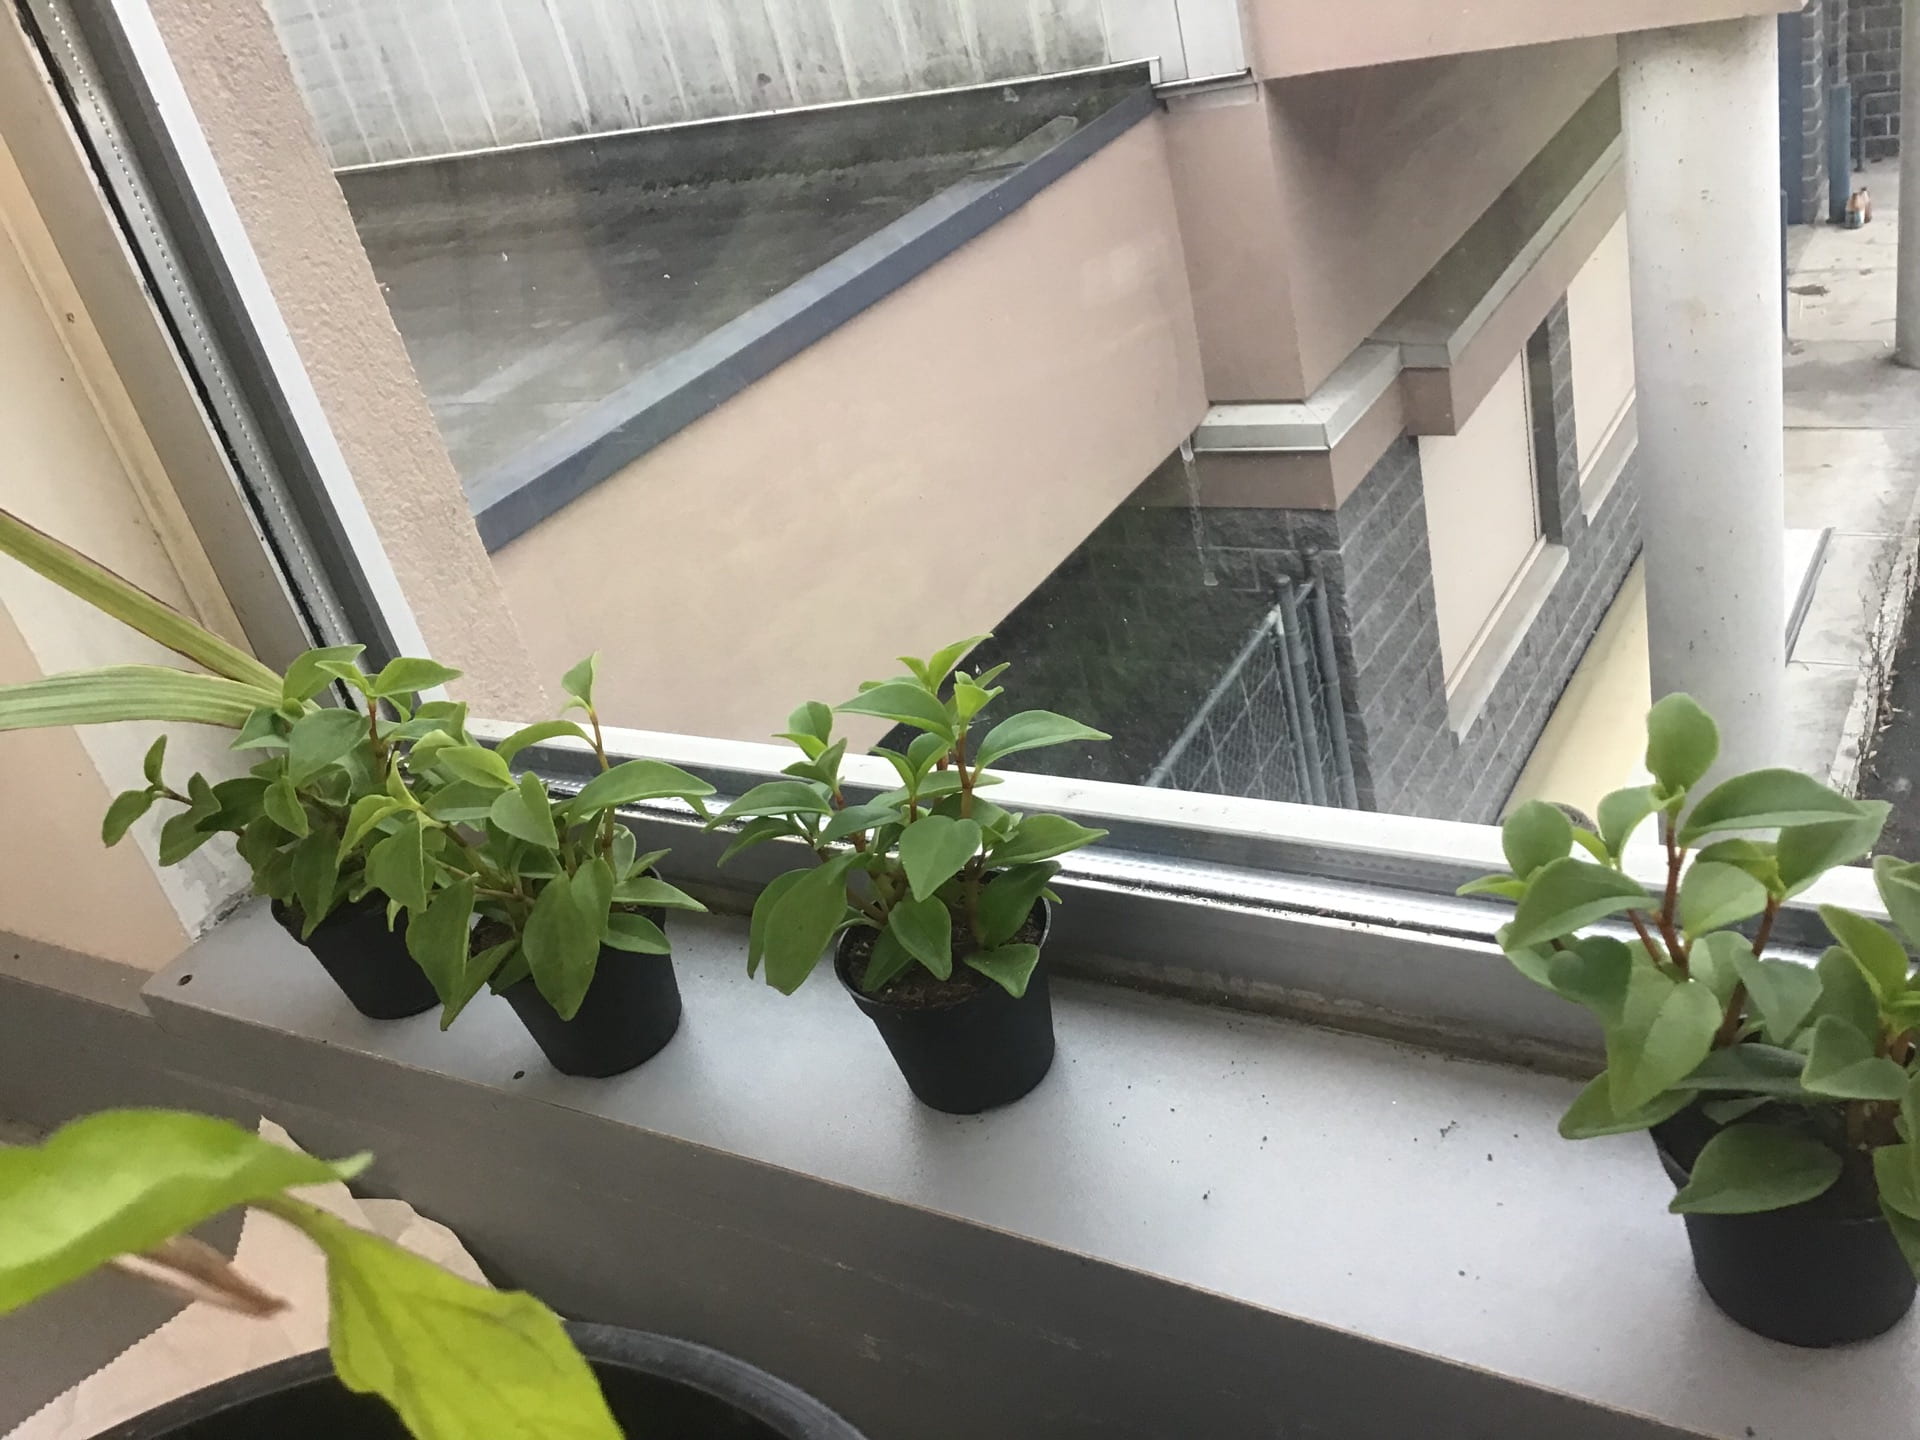
October 16th 2019:
We start making our graph and analyzing our data. We have one last look at the plants before we start to write our results. The tap water plants look much more healthy than the grey water plants. Their leaves are greener, there stems are deeper in colour, and they are slightly taller. The biggest difference between the two is that the grey water’s plants leaves look a lot more dry and some even look a little shrivelled with small blemishes on them.

Graphs:
Part D: Analyze
Height Graph: The height of the plant can determine how healthy the plant is by how much it has grown. Healthier plants should be taller as they grow to their full height. The tap water plants are both taller than the grey water plants although not by much which is to be expected as they have only been growing under grey water for three weeks. The plant colour however is a lot more noticeable despite the short time when watered with grey water.
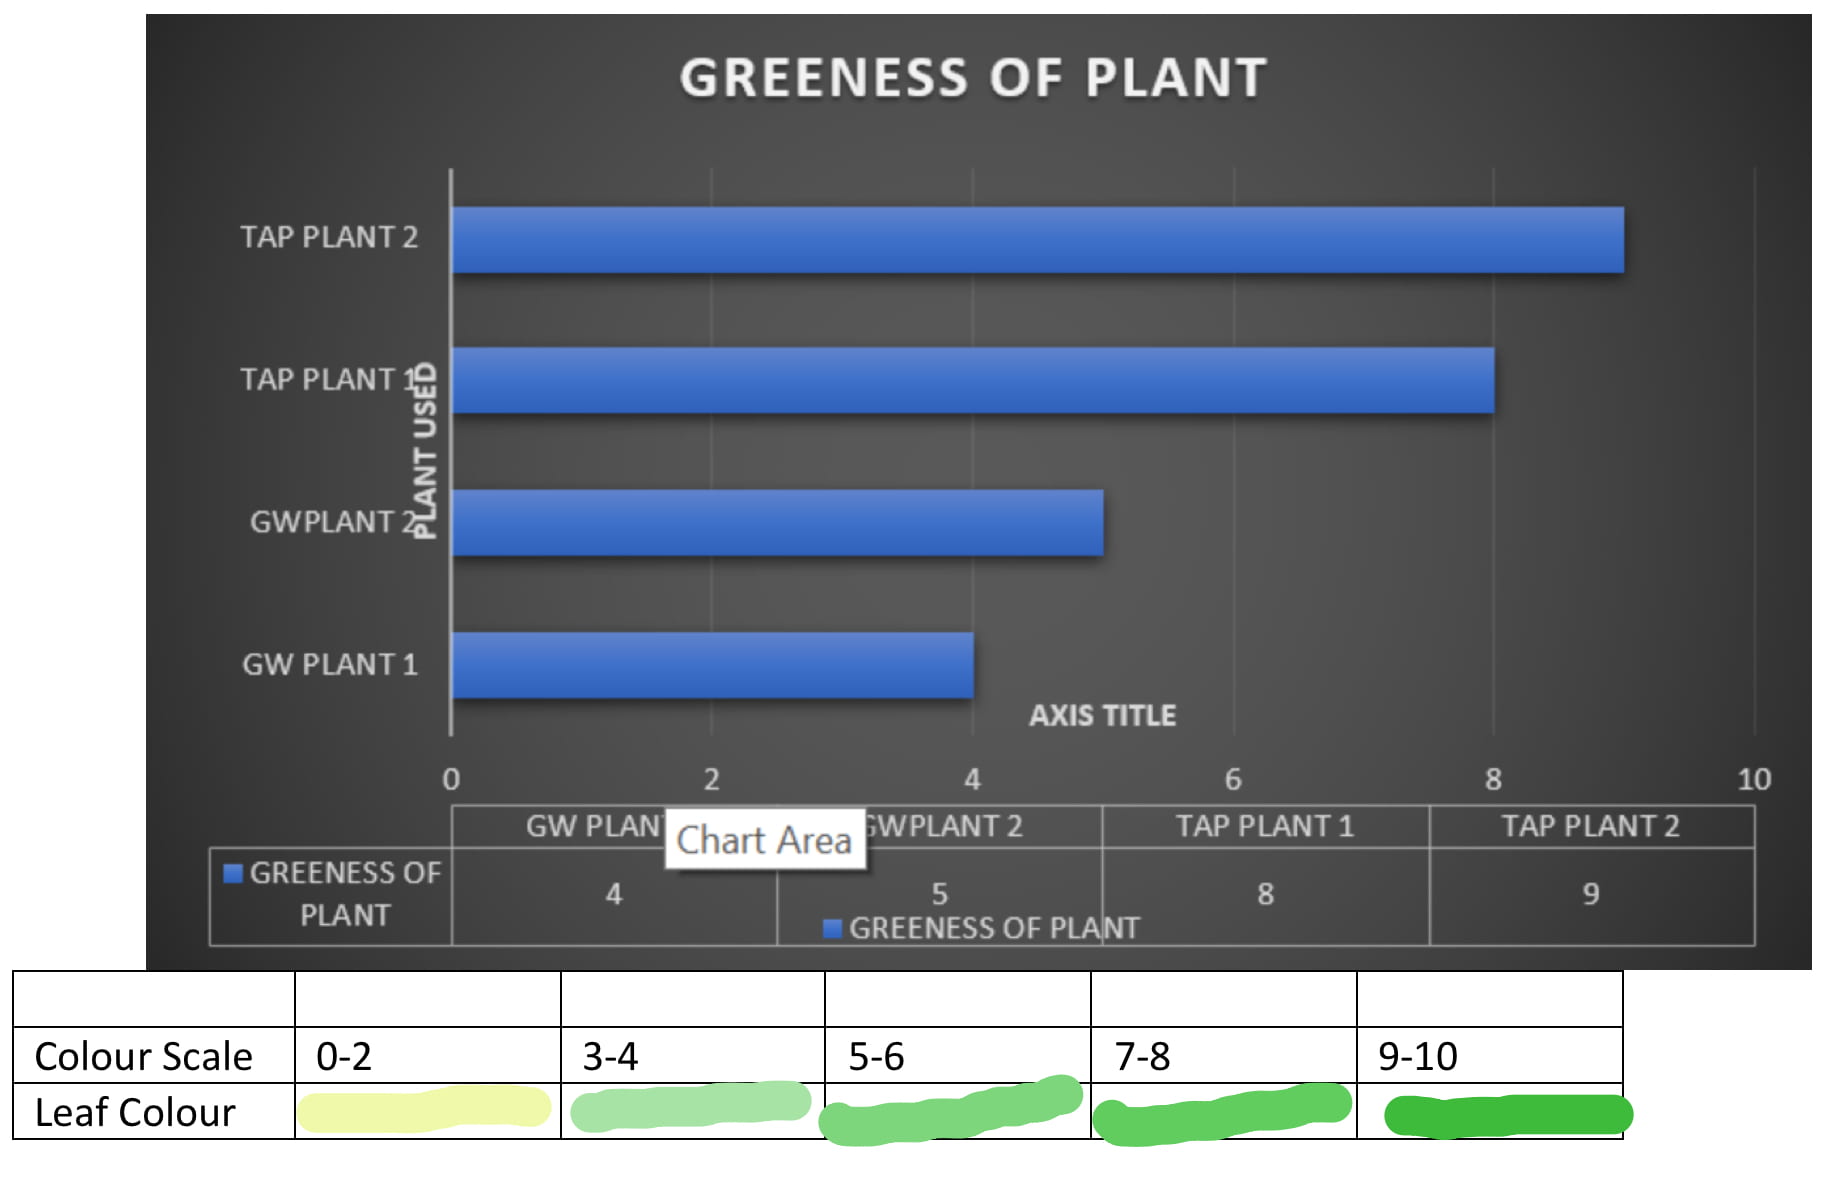
Plant Colour Graph: We can determine how healthy each plant is or how dry each plant is be looking at the colour of the leaves. The grey water plants leaves are a lot lighter shade of green and look like they need a little more water despite the fact that they have been watered equally throughout the three weeks.
Relationship Between Variables: Our variable that we changed for each of the two sets of plants was what we watered each with. The first two plants we watered with ordinary tap water. The second two plants we watered with grey water (Dish washing soap and water with Dawn dish soap). The relationship between the plants watered with grey water and the plants watered with tap water is that the grey water plants look more dry and don’t have as deep colours. They are also slightly smaller and have some small blemishes on the leaves. This shows that when watered with soapy water, the plants become less healthy than when watered with tap water.
Inconsistencies: The only small inconsistency was that one of the tap water plants also had a couple of small blemishes on the leaves but they were minor compared to the ones on the leaves of the grey water plants.
Part E: Conclusion
Hypothesis (was it supported), Our Conclusion, And Can There Be Other Conclusions: The data that we collected supported our hypothesis. Our hypothesis is, plants watered with grey water will still grow but not as much as the plants watered with tap water. We were correct to state this although there wasn’t as big a difference in height as we thought there would be. However, the plants watered with grey water differed from the tap water plants in another way. The grey water plants look more dry than the tap water plants even though we watered each equally. Both leaves and stems of the grey water plants didn’t look quite as healthy and that brings us to our conclusion. Over the span of three weeks, we have determined that a tropical indoor plant will grow when watered with grey water. However, it will not grow as well as one watered with tap water as they may not reach their full height and become dry even if watered regularly. Our conclusion should be the only conclusion even if others do the same experiment. The only way somebody doing our experiments conclusion could change is if the plants don’t get the exact same treatment (except for the variable) or if different plants are used.
Methods And Conditions Of Experiment:
Sources of Error: We did pretty good in not having anything wrong but even the best scientists make mistakes. Our biggest mistake was not measuring the height of the plants at the start of our project so even though we know that the tap water plants are bigger, we don’t know exactly how much each one grew.
Confusing Variables: Throughout the three weeks, we did everything exactly the same to each of the four plants. The only variable that we changed was that two of them we watered with tap water, while the other two we watered with grey water (water with mixed in Dawn dish washing soap). We found that we didn’t have any confusing variables because we were so careful to make sure that everything was done the same to each plant.
Areas For Improvement: In any experiment there is always ways to improve. In our experiment we could’ve improved a couple of things such as measuring the height of our plants at the start of our experiment. We could have also used more plants as we had two for each tap and grey water. The data probably would’ve been more reliable had we used three plants for each tap and grey water. These are the two biggest ways we could’ve improved our experiment but as in all experiments there is always many different ways to improve no matter how small the improvement.