
This week we started with new lesson : Graphing Quadraction Functions about the determine the value of vertex, formula, what the graph looks like and how to draw the parabola.
So let’s start the things I studies in this week :

With a (coefficent) it will helps us know the graph will be big or small.
Also, we can know : If quadratic positive 

It will be like this in graphing:


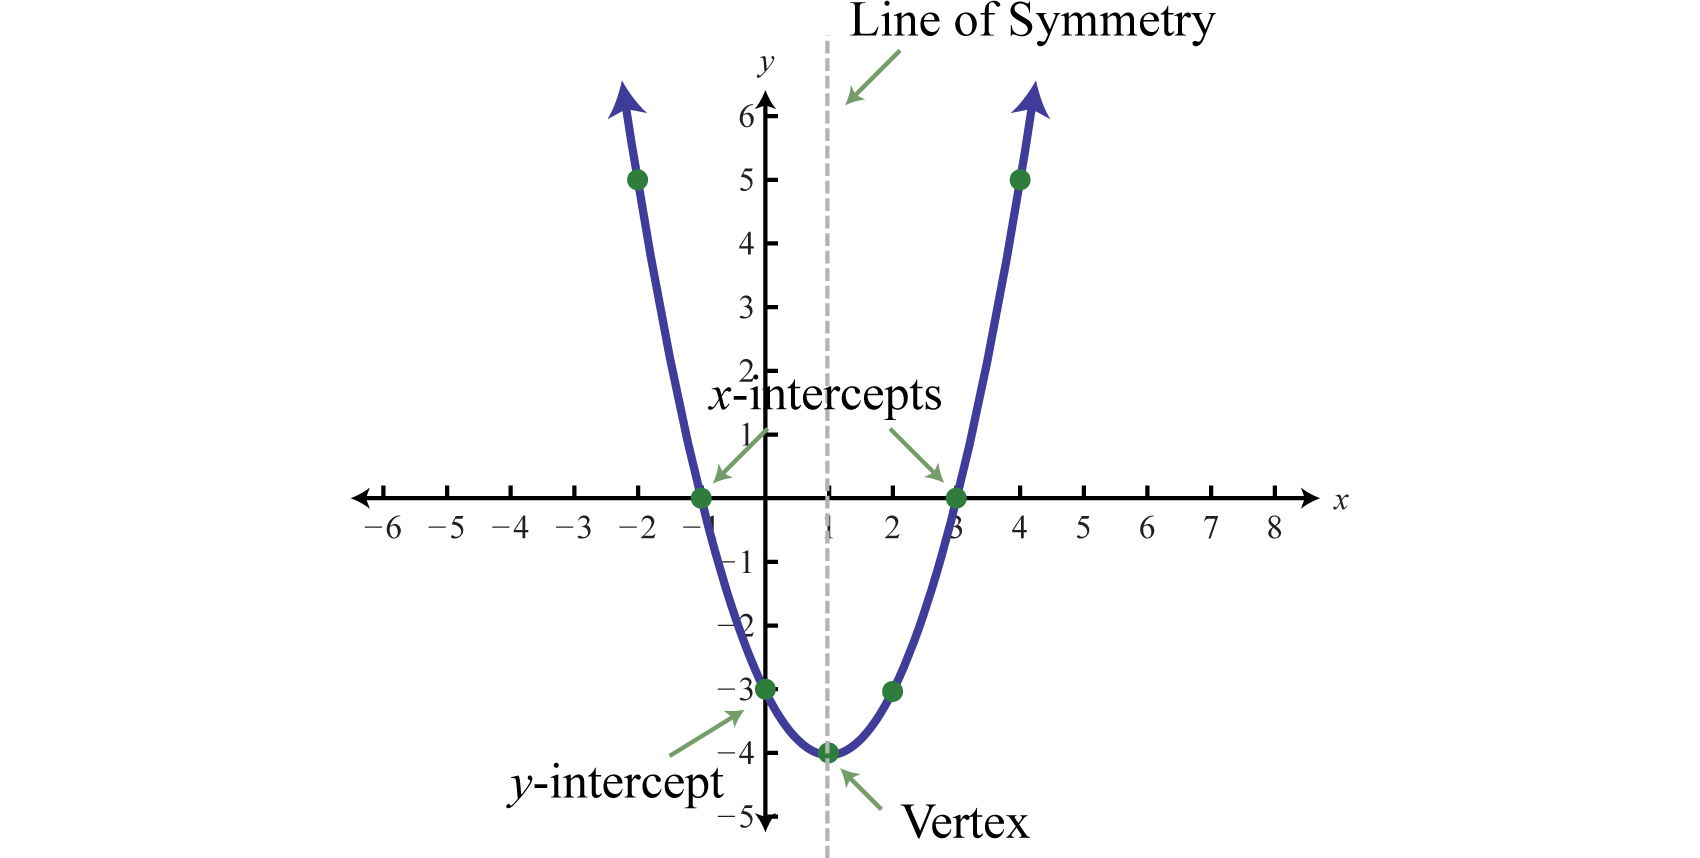
Vertex : highest and lowest point (-1,4)
Axis of Symmetry : which the parabola is symmetric (-1) of above picture
x-intercepts : zero of function or we can determine it by Quadractic Formula
y-intercepts : it depends on c
Maximum point : when the graph opens down Because the intersection point between x and y is at the top
Minimum point : when the graph opens up so the intersection point between x and y is at the bottom
Pattern of Parent Function :
But if 
Domain : the value of x and the complete set of possible values of the independent variable, make sure it is real number.
Range : the value of y
^2")
Let’s star with example :
^2")
^2")
