This week I learned how to graph a line and figure out what side has all possible solutions.
Example.
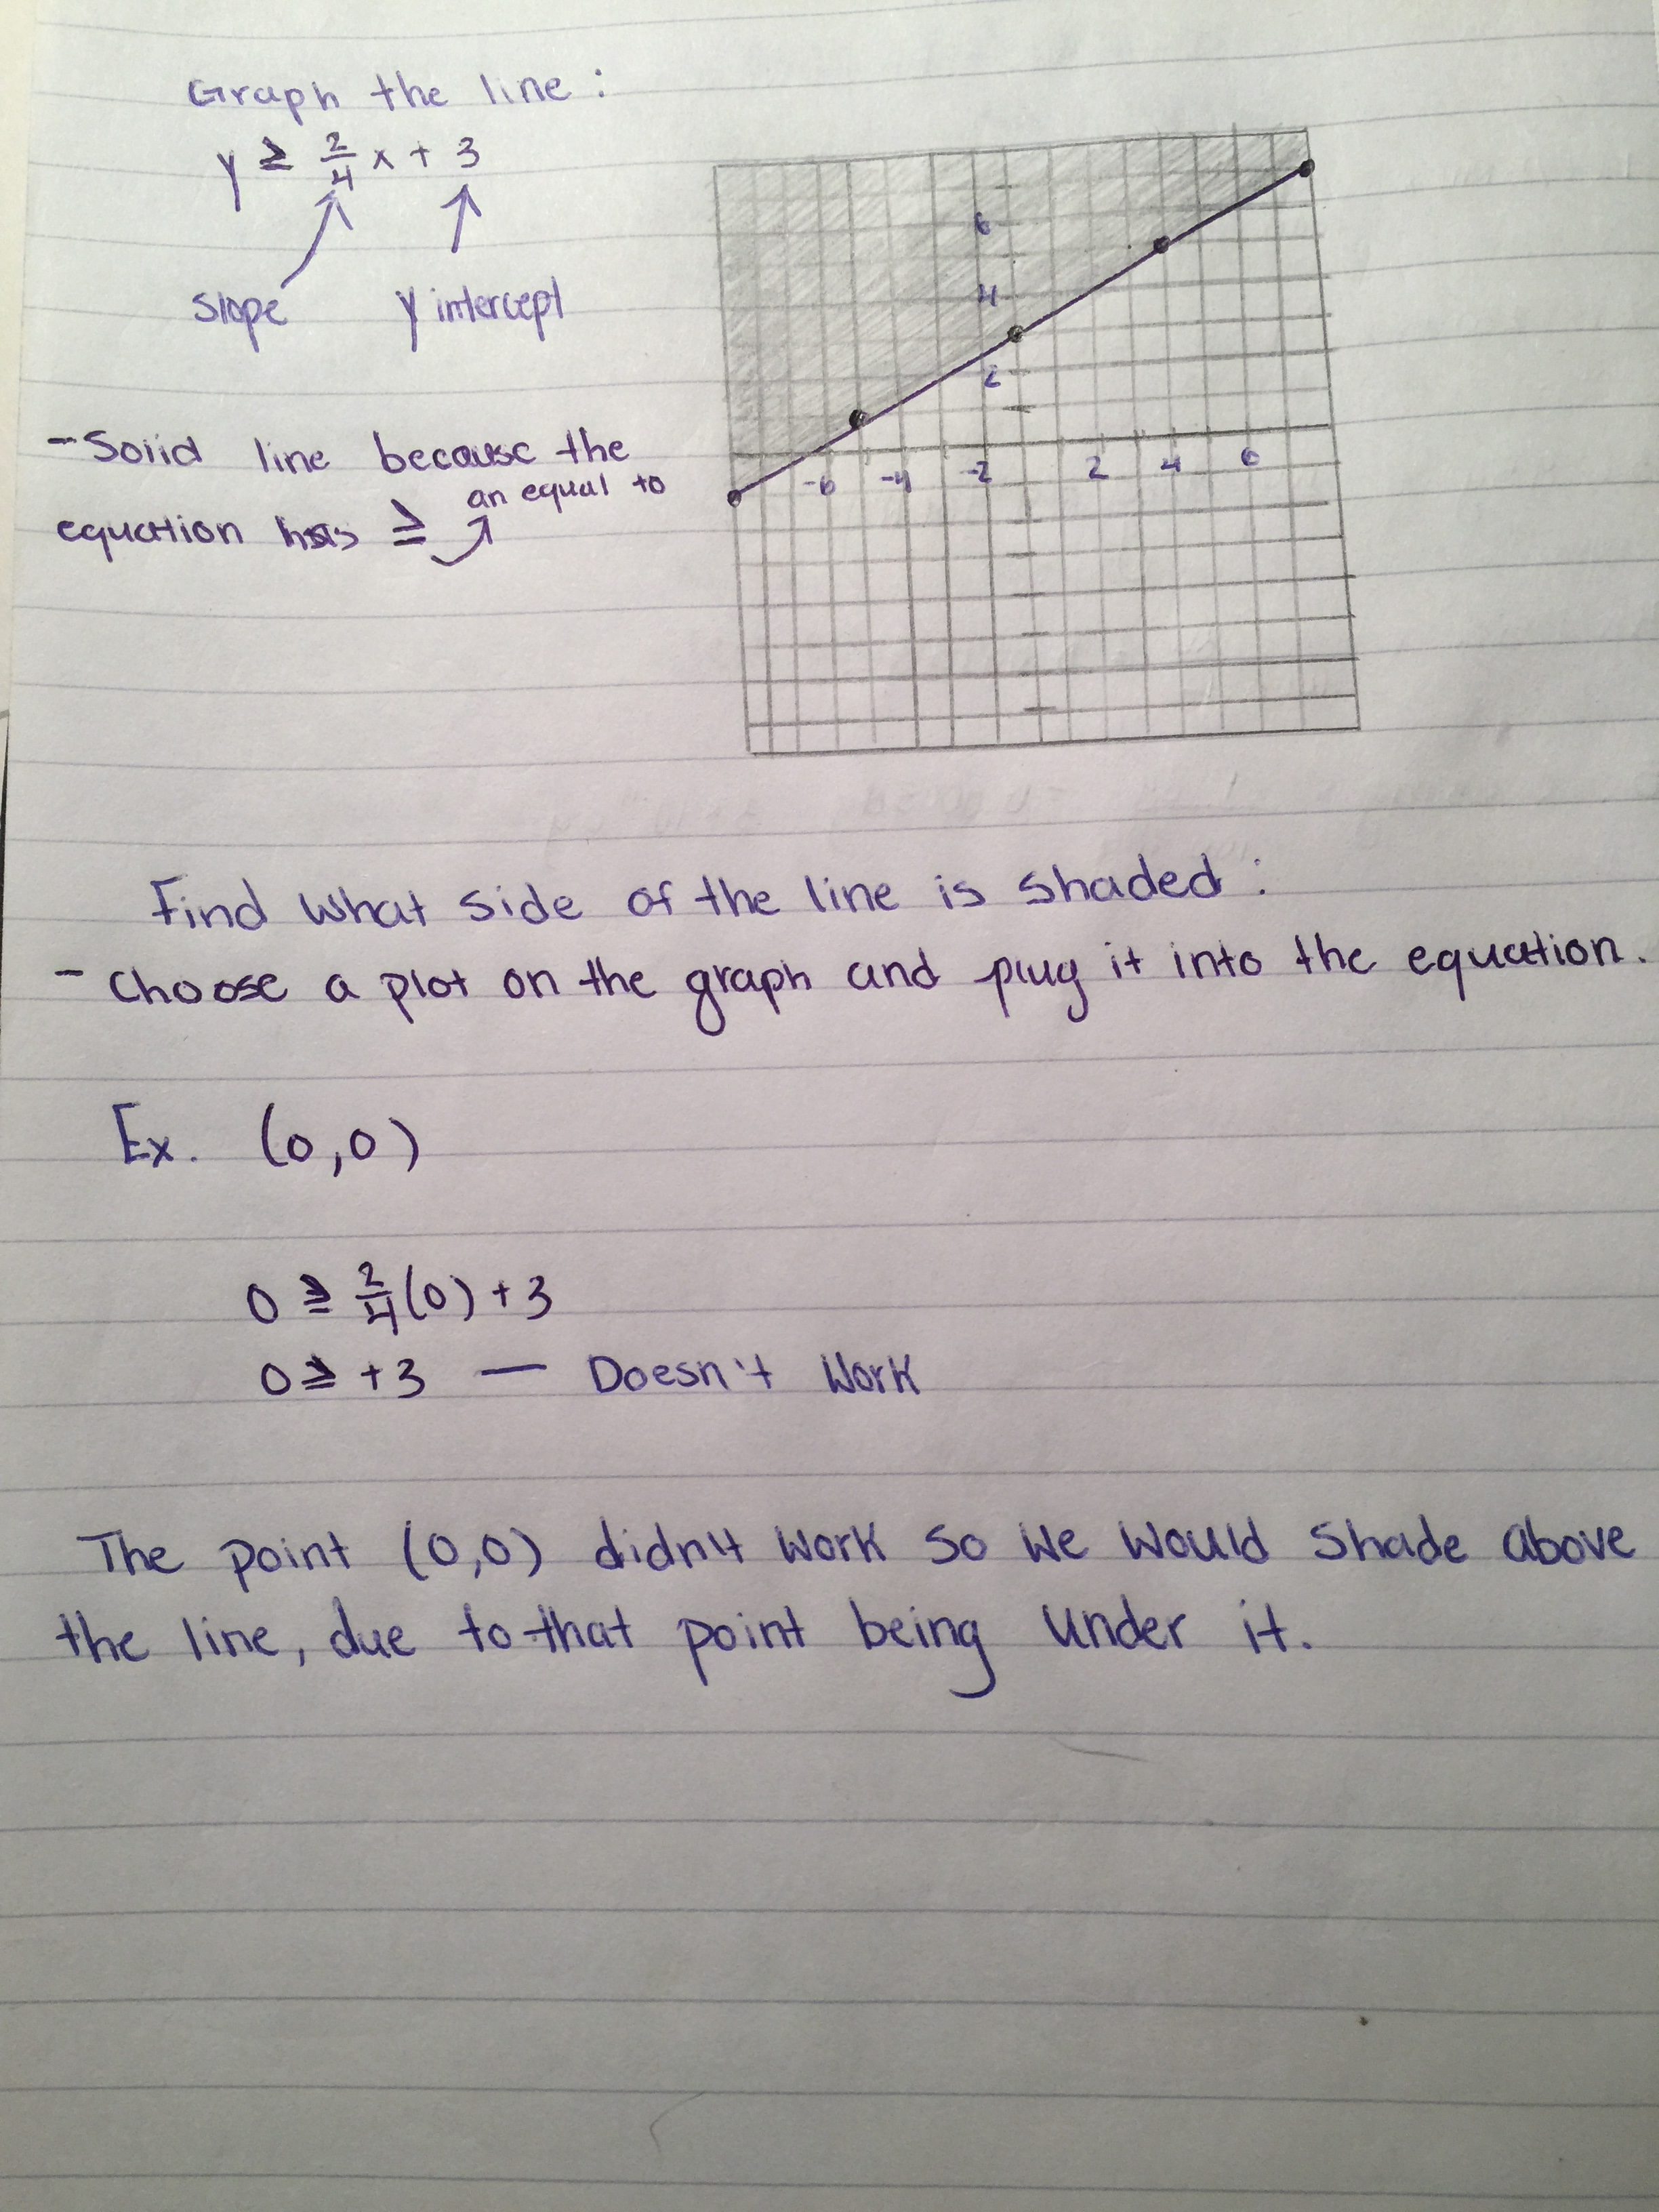
With the line plot it on a graph by finding the y intercepts and the slope. Decide on if the line is solid or dotted by looking at the sign. if the sign is less than or greater than it is a dotted line, if it is less than or equal to, or greater than or equal to, then it is a solid line. By finding what side to shade, pick a plot from a side of the line and plug it into the equation. If the plots work with the equation then shade that side of the line where you got that point from, if it doesn’t shade the other side.