Dec
2017
Week 14 in Math 10
In week 14 of math 10 we learned how to tell the difference between a function or a relation just by looking at a graph, mapping diagram or a table chart.
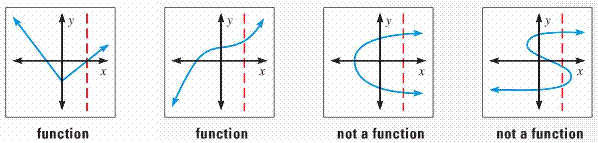
graphing: If there are dots that have the filled in circle that are found vertically on the sae x value then that is a relation, if there are two lines found vertically above each other than that is a relation as well.
mapping diagram: If your X values are the same then that is a relation, if they are all different that is a function, the only way for X to have the same values as each other is if the Y values are the same for both.
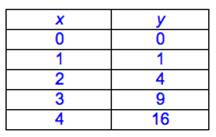
table chart: If your X values are the same then that is a relation, if they are all different that is a function, the only way for X to have the same values as each other is if the Y values are the same for both.