Inquiry PowerPoint
categories: Math 10
Was Math Invented or Discovered?
My Riverside Rapid Digital Portfolio
Was Math Invented or Discovered?
Our discussion:
Below, I solved various equations using algebra tiles.
(X+1)^2
= (X+1)(X+1)
= X(X-1)+1(X+1)
=
= 

= (X-1)(X-1)
= X(X-1) + 1(X-1)
=
=

(X+1) (X-1)
= X(X-1)+1(X-1)
=
=

= (X-1) (X-1) (X-1)
=
=
=
This assignment taught me how to you the $latex coding directly in my blog post. Before, I couldn’t figure out how to show my polynomials online, but this really helped and I will definitely use this is the future. I also visually saw how polynomial are distributed, as well as what can be modeled and what cannot. For example, the last question (^3")
Below I have created 4 instructional videos for the unit of Exponents, Measurement, Trigonometry, and Polynomials to help prepare for the math 10 midterm.
Ms. McArthur, please watch the Polynomials video.
Exponents/numbers
Measurement
Trigonometry
Polynomials
Sources: Practice tests/worksheets
Sine, Cosine and Tangent (also known as sin, cos, and tan when on a calculator) are ratios of right triangles that are used throughout the unit of Trigonometry.
In an angle, there is a hypotenuse (longest), an opposite side (across from hypotenuse), and a adjacent (the one left over);
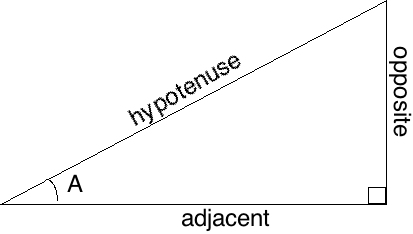
To find the Sin, you would divide the opposite side by the hypotenuse.
To find the Cos, you would divide the adjacent by the hypotenuse.
To find the Tan, you would divide the opposite side by the adjacent.

Today in Math 10 Honours we looked into the volumes and surface areas of different 3-dimensional shapes and objects, including cones and pyramids. Then, Ms. McArthur gave us the task of figuring out the volume of a Garibaldi lake, which is a lake located not far from Squamish. I decided that the shape of the bottom of the lake is a cone, as it makes the most sense being surrounded by mountains. We were given the average surface area and depth of lake – here are my results;
Average surface area = 9.94km
Depth of lake = 119m
–
1 km = 1000m
9.94km = 9940m^2
9940m^2 x 119m = 1 182 860m^3
1 182 860 / 3 = 394 287 m^3
(divided by 3 because that is a part of the formula of the volume of a cone)
My final answer is equal to 394 287m^3 (or 394 287 000L)
–
If the barrier, which is over 250 metres long were to collapse, I assume that over 75% of the water would escape, which is around 295 708 500 Litres of water (394 287 000 x 0.75) because in my opinion, only the water closer to the surface would flow out (since the part that is on the bottom is caved and not guarded by the dam).
Photo source:
https://media-cdn.tripadvisor.com/media/photo-s/02/3e/45/f5/garibaldi-lake-from-panorama.jpg
Today in math class, we went outside to look for 2 items that could be identified as units of measure. My partner Soha and I found a stick and a container of water that could help with the measurement of length and density. Later, we watched a video on the history of measurement/read about it in our manuals, in which I learned that units of measure were discovered in the ancient times; much longer than I had thought. They used things like human body parts of important people (such as kings) and the distance that a certain animal ran without getting tired to measure centimeters, metres, kilometers, yards, etc. I find their ideas for measurement very interesting, unique, and incredible that we now have all these different units.


We used the equation y=3^-x and tried to graph the points on paper by first filling out a data table and then raising the Y axis number on the graph by 15 each time. When X was positive, Y was less than 1, and when X was negative, Y was much greater than one. The distances between the points increased quite rapidly, so it was difficult to graph the numbers, as there was a big difference between each. This activity helped me to see the relationship between the positive and negative exponents.
When compared, we noticed that group #5’s graph is the exact opposite of ours, as theirs is positive (y=3^x) and ours is negative (y=3^-x). The graph was flipped on the y axis, but other than that, all the numbers on the Y axis were the same (just in different/opposite order).


^2")


(X-1)")
