
Graphing absolute value quadratics. When graphing an absolute value quadratic’s you basically reflect whatever is below the x axis.
example
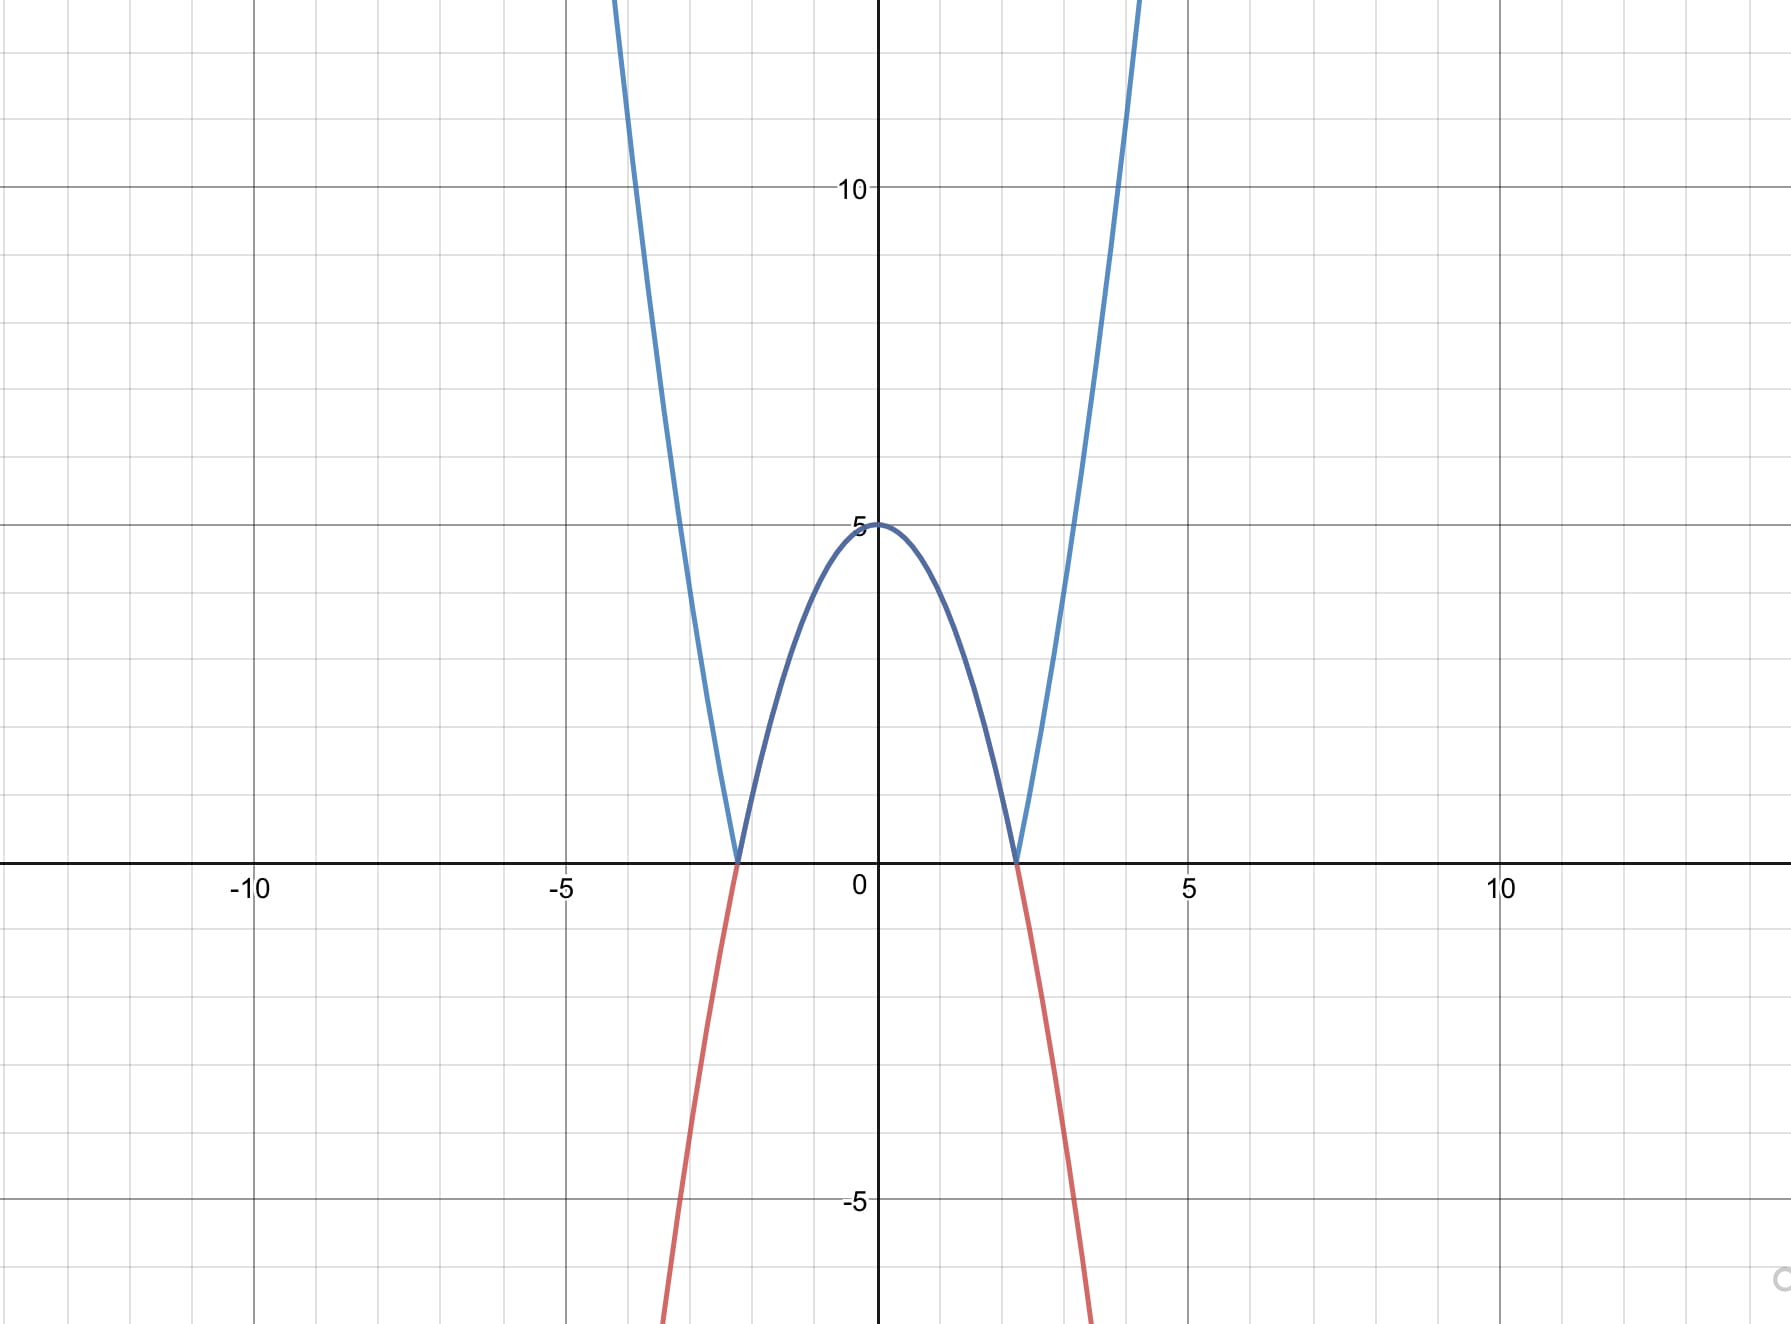
Original Y = -x^2+5 is red
Absolute Y = l-x^2+5l is blue
If the whole parabola is below the x axis this is what it looks like.
Original Y = -x^2-3 is green
absolute Y = l-x^2-3lis blue
