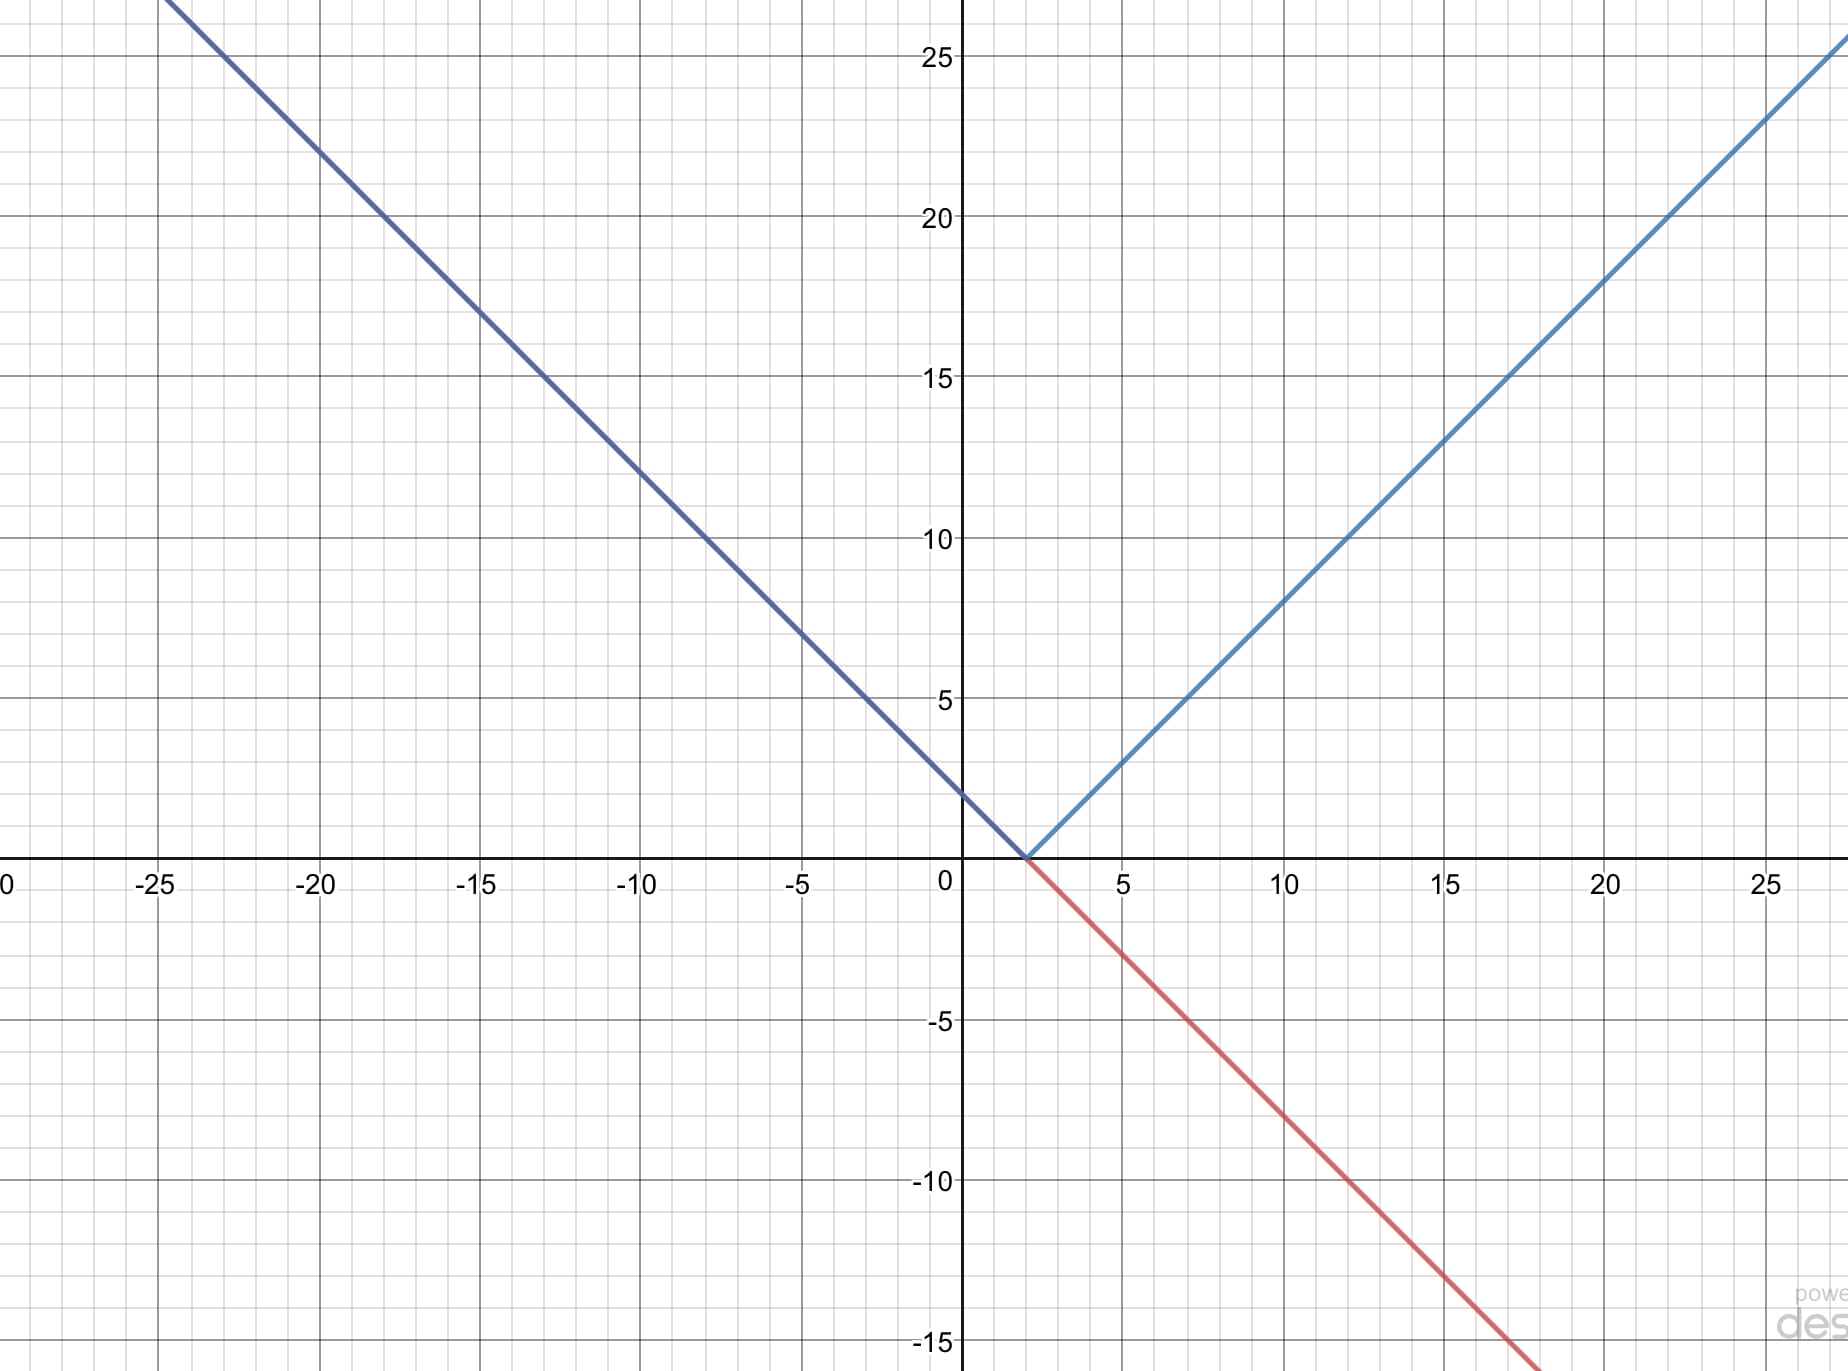
Graphing absolute value linear equations, the just of it is that nothing can be below the xaxis instead it is reflected off of the x axis to create a v graph.
example:
original y = -x + 2 is red
absolute y = l-x + 2l is blue

Graphing absolute value linear equations, the just of it is that nothing can be below the xaxis instead it is reflected off of the x axis to create a v graph.
example:
original y = -x + 2 is red
absolute y = l-x + 2l is blue
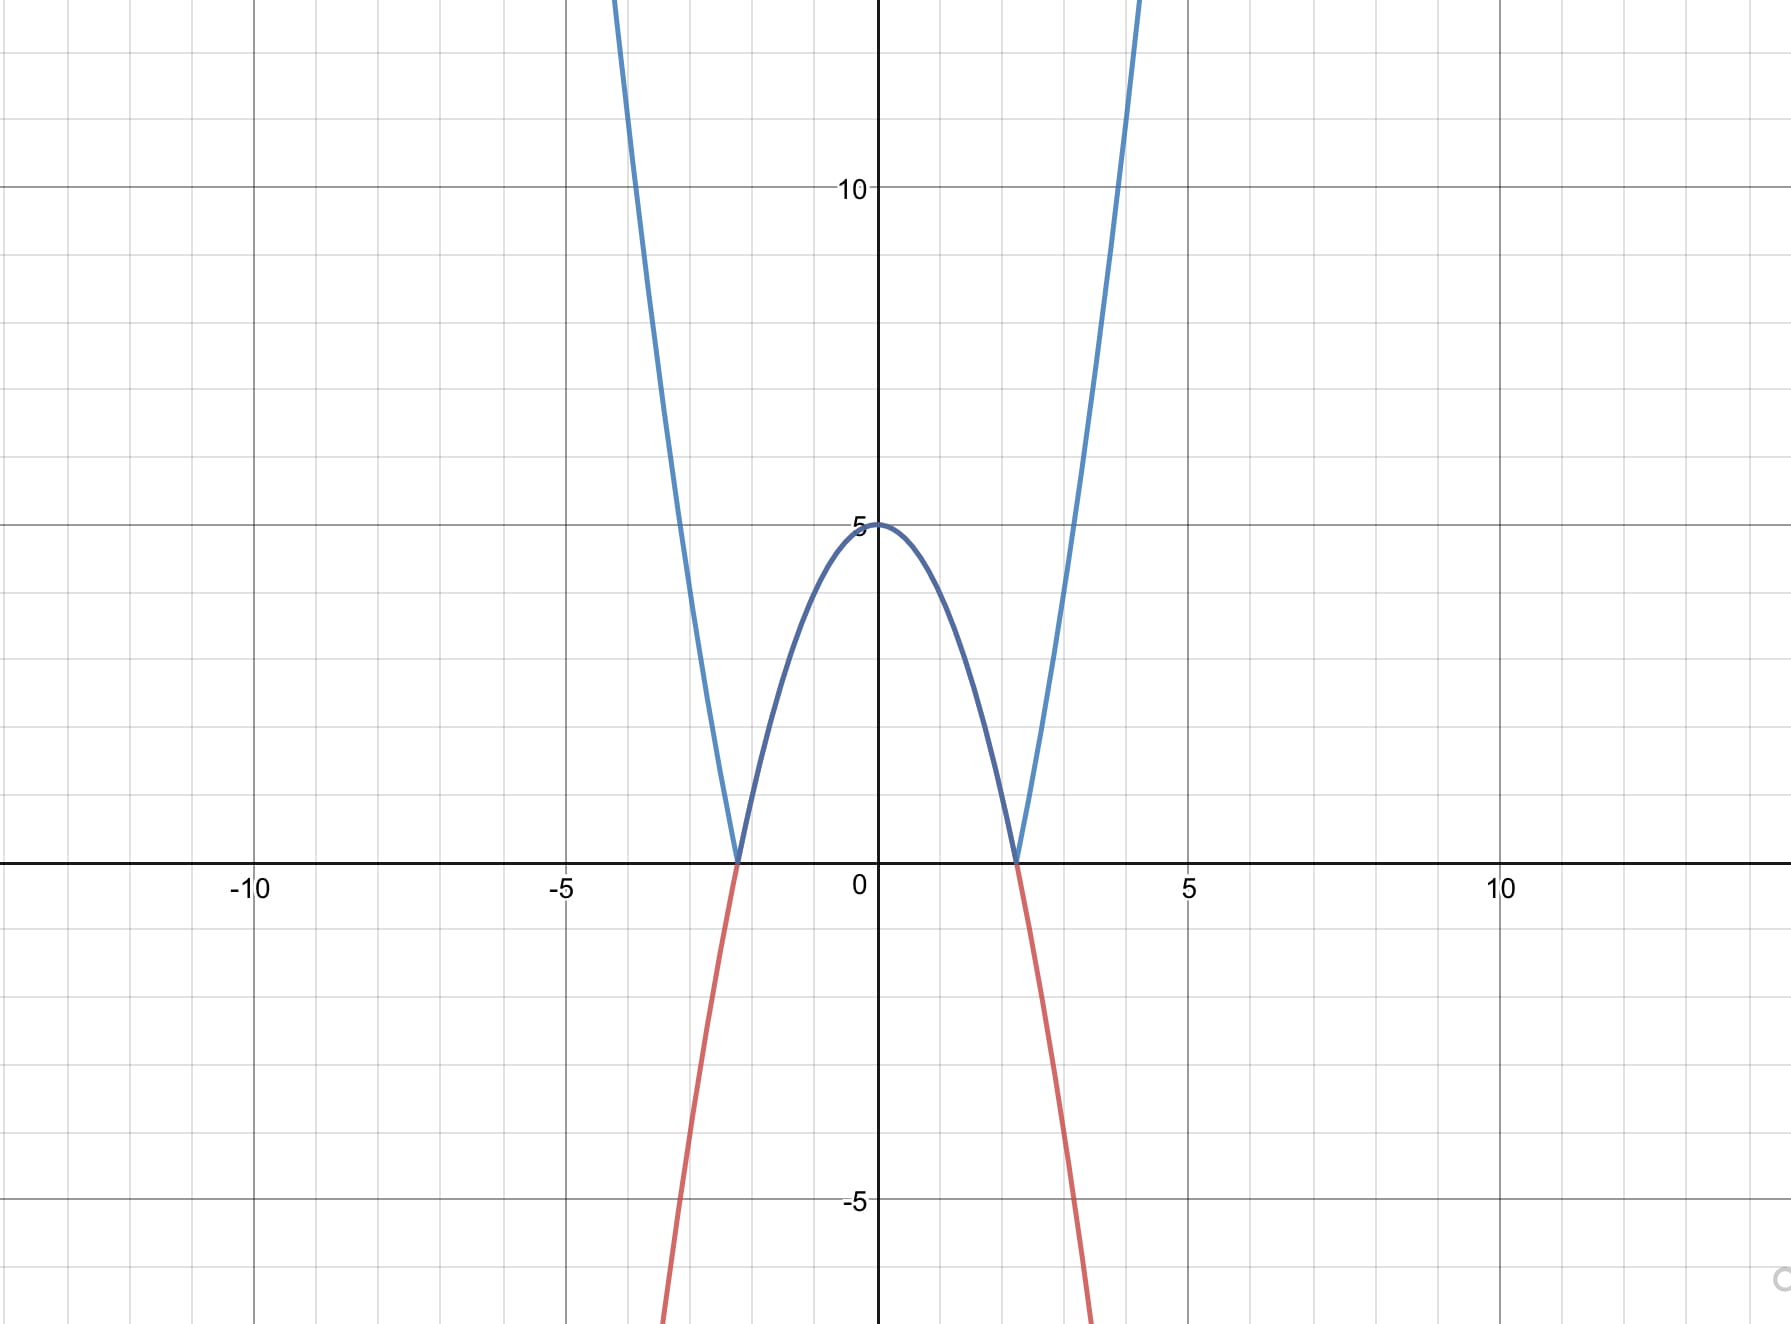
Graphing absolute value quadratics. When graphing an absolute value quadratic’s you basically reflect whatever is below the x axis.
example
Original Y = -x^2+5 is red
Absolute Y = l-x^2+5l is blue
If the whole parabola is below the x axis this is what it looks like.
Original Y = -x^2-3 is green
absolute Y = l-x^2-3lis blue
