This week, I’ve learned about absolute values function on graphing.
And in this blog, I’m going to talk about how to graph an absolute value function of linear equations.
Just a recap, but we do know that for absolute values, we must remember that:
- the sum inside the absolute value symbols will always be positive !
Taking the main idea that we can never get any negative answer in absolute values, since we have an equation of y=|mx+b| then if we graph our linear equation, we must never have any lines within the negative y side of the graph.
So how exactly do we graph it?
First of all, we must know what the parent function is of the graph equation we are given.
For example, we have y = |3x + 6|
If we take the absolute value out, we get y = 3x + 6
Secondly, we must figure out what the x-intercept is, doing it by graphing or algebraically doesn’t matter as long as we figure out what the x-intercept is accurately.
And in our equation y = 3x + 6, we want the y to equal zero so we could figure out our x-intercept.
In this case, it’s
0 = 3x + 6
-6 = 3x
-2 = x
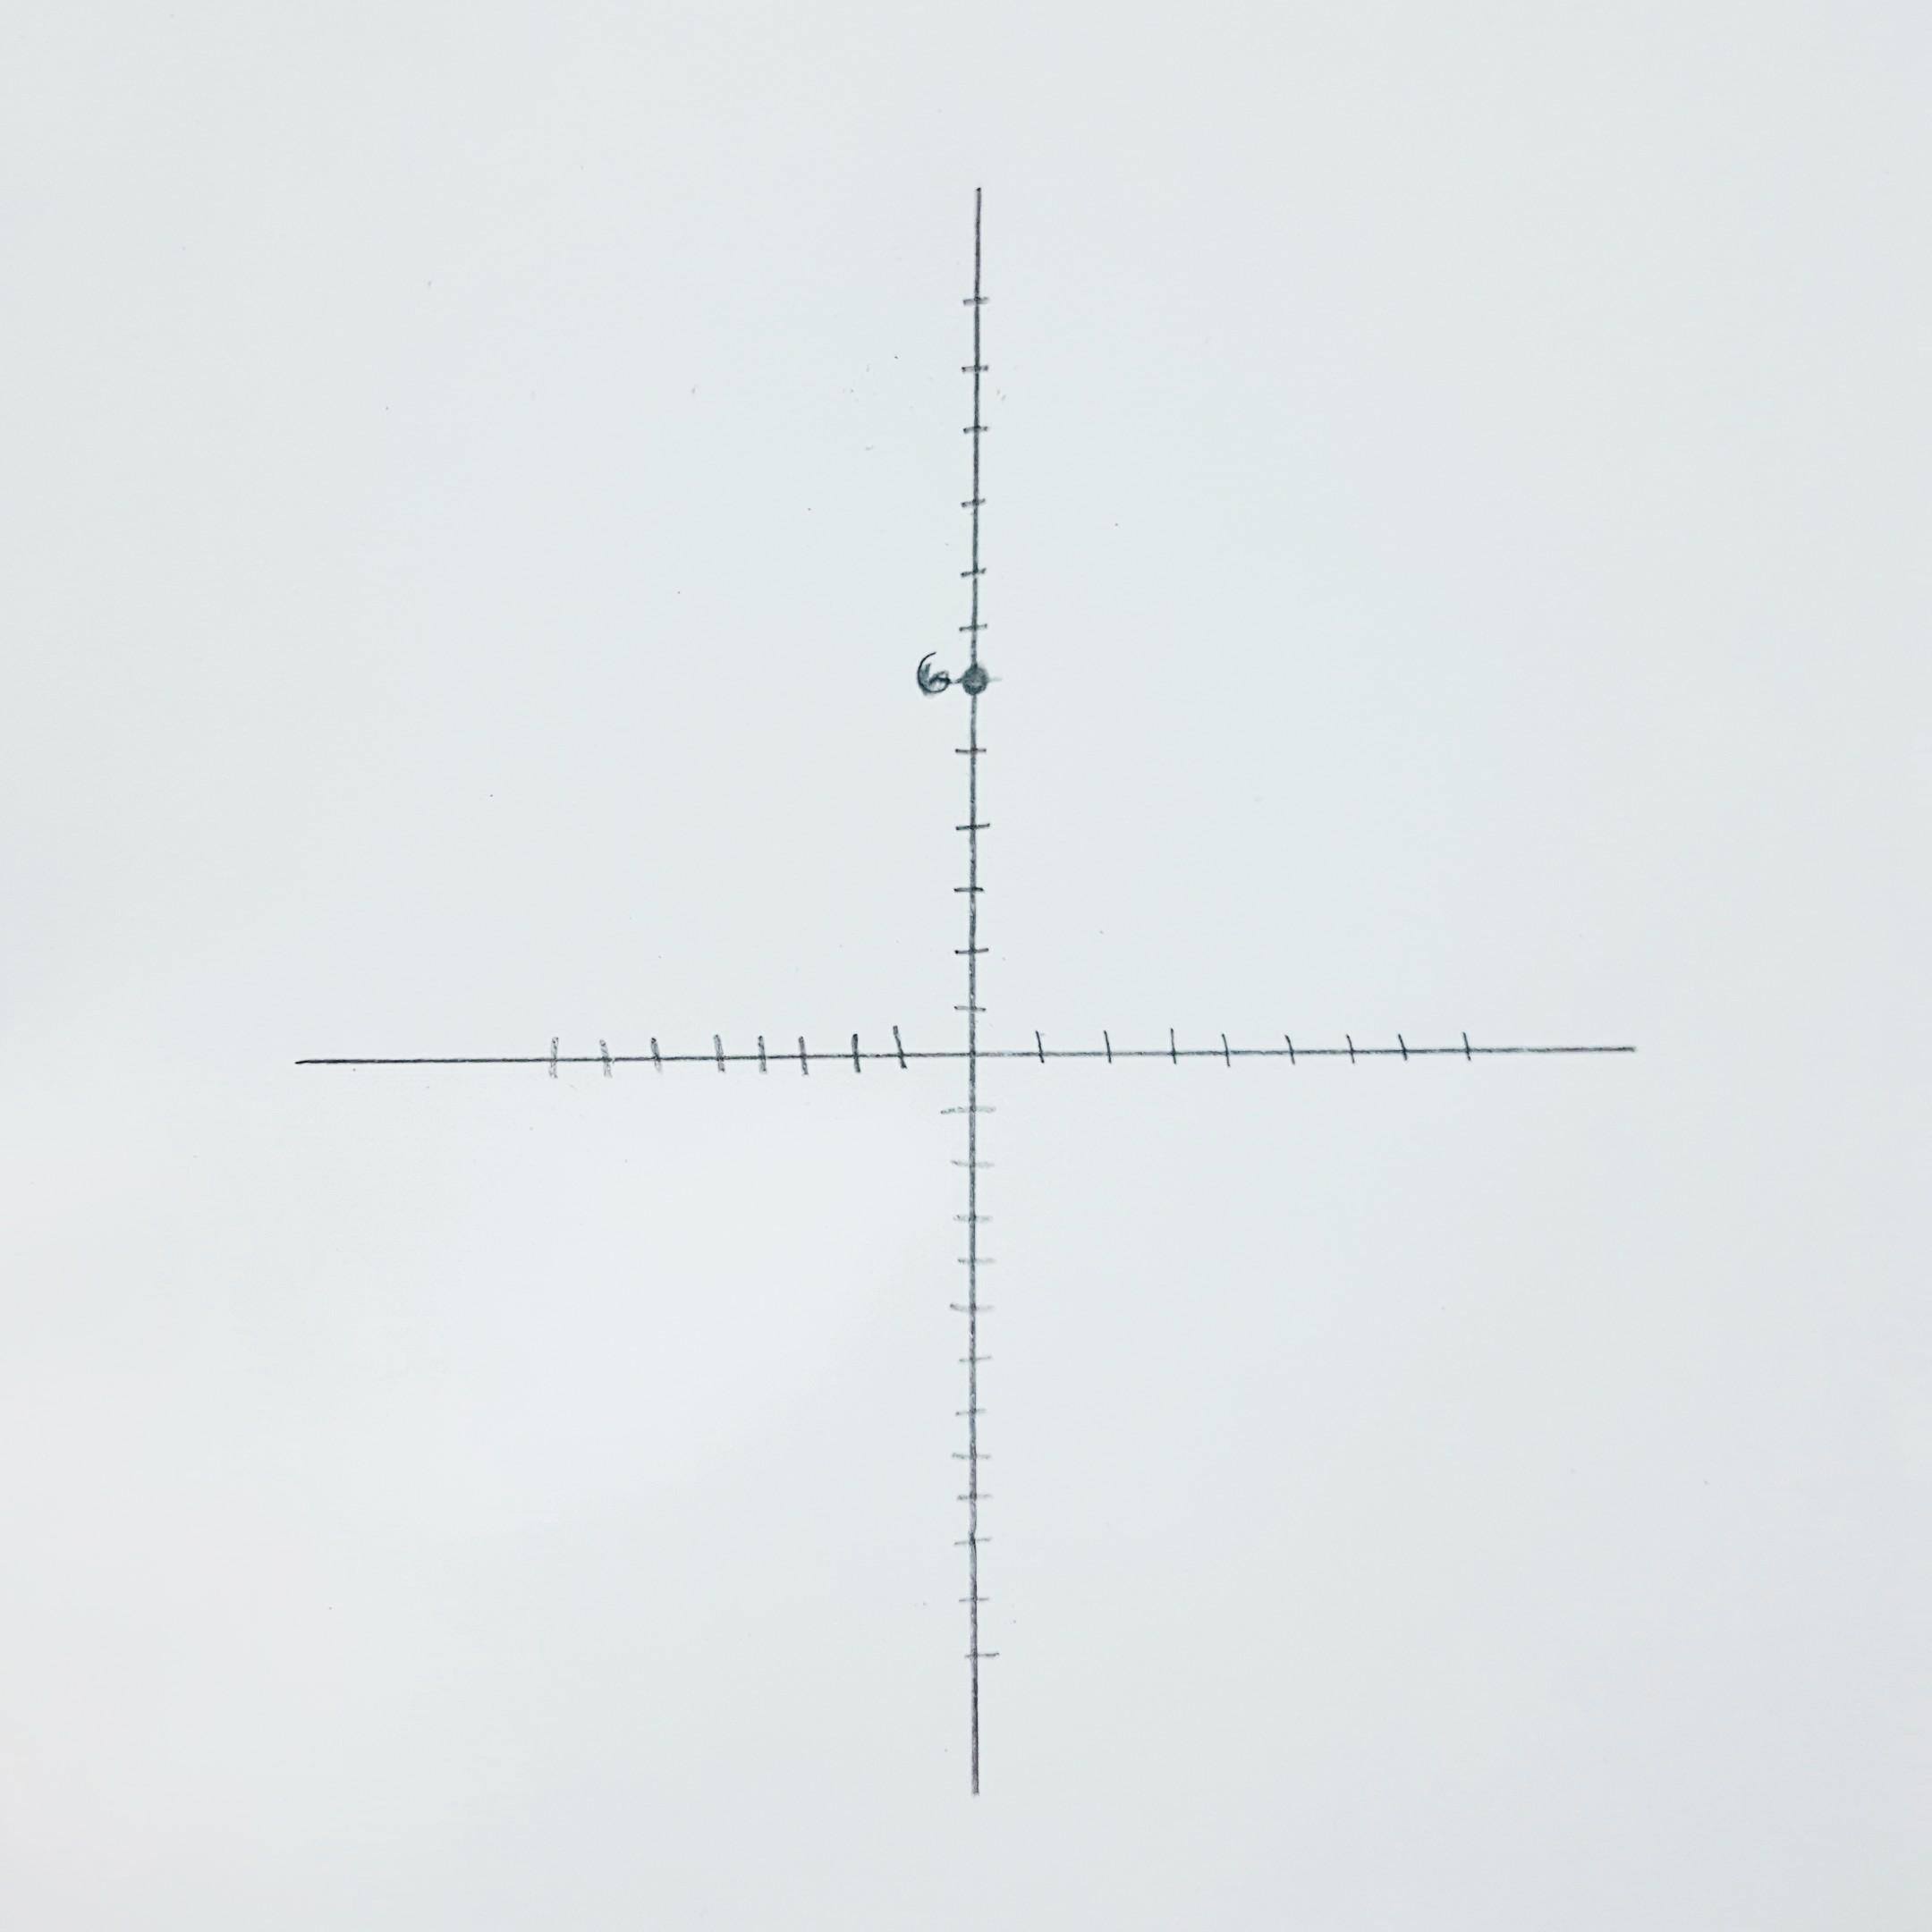
Now that we’ve figure out what the x-intercept is, we can start graphing by taking the y-intercept, which is (0, 6) in our equation.
After that, make a vertical dashed line to where the x-intercept is.

Then, graph the equation without the absolute value.

Then, what you’re going to do is to make the graph “reflect” from the x-axis from where the x-intercept is. Remember that the reflected graph HAS THE NEGATIVE SLOPE OF YOUR ORIGINAL LINE!!!

If you’re stuck, just remember the idea of absolute value not having a negative as an answer!!