An Absolute value (||) means whatever inside is going to be positive, when we put a linear function within ||, it becomes an absolute value linear function.
The graph of it will change, as we know, a linear function is a straight line, either having a 0 slope or / positive slope or \ slope.
When graphing an absolute value linear function, if the slope is not 0, the line will bounce back up in the opposite direction of the original function at x-intercept.
Why is that?
Let me show you an example:
2x+4=y, a simple straight line with a slope of 2, and y-intercept of 4.
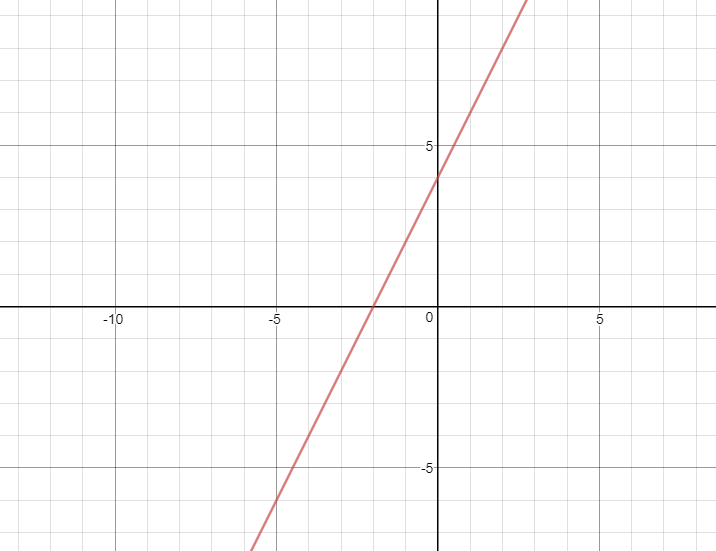
But magic happens when you put||on to the function. As the output of an absolute value cannot be negative, y, in this case, will also have to positive. But with our previous graph of the original equation, the Y clearly dipped under 0.
Let’s see what happens if we put an x value that would make y<0 into the absolute value equation. |2x(-4)+4|=4,
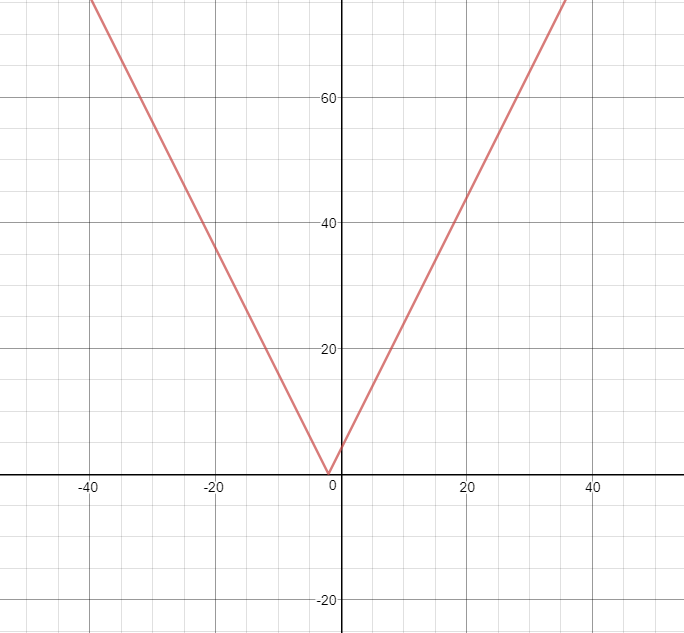
the Line reflected up, from this example we can learn that when graphing a linear absolute value function, all you need to do is find the x-intercept of the original line and draw a reflected line from the original root.